

Mean field strategies induce unrealistic non-linearities in calcium puffs
- PMID: 21869877
- PMCID: PMC3150724
- DOI: 10.3389/fphys.2011.00046
Mean field strategies induce unrealistic non-linearities in calcium puffs
Abstract
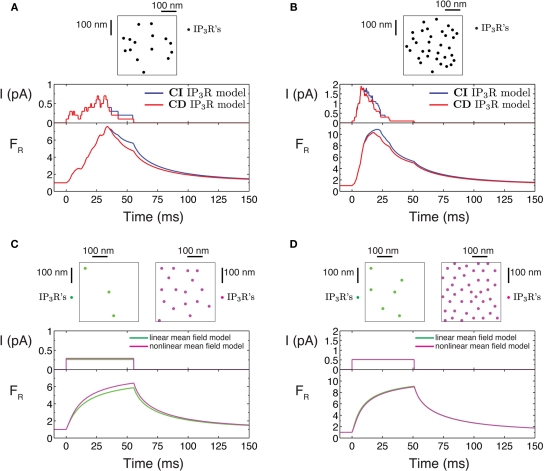
Mean field models are often useful approximations to biological systems, but sometimes, they can yield misleading results. In this work, we compare mean field approaches with stochastic models of intracellular calcium release. In particular, we concentrate on calcium signals generated by the concerted opening of several clustered channels (calcium puffs). To this end we simulate calcium puffs numerically and then try to reproduce features of the resulting calcium distribution using mean field models were all the channels open and close simultaneously. We show that an unrealistic non-linear relationship between the current and the number of open channels is needed to reproduce the simulated puffs. Furthermore, a single channel current which is five times smaller than the one of the stochastic simulations is also needed. Our study sheds light on the importance of the stochastic kinetics of the calcium release channel activity to estimate the release fluxes.
Keywords: 02.30.Jr; 82.33.-z; 87.16.A-; 87.16.Vy; 87.17.-d; calcium signals; mean field model; puffs; stochastic model.
Figures


Similar articles
-
The dynamics of stochastic attrition viewed as an absorption time on a terminating Markov chain.Cell Calcium. 2005 Aug;38(2):73-86. doi: 10.1016/j.ceca.2005.06.007. Cell Calcium. 2005. PMID: 16099503
-
Calcium-dependent inactivation and the dynamics of calcium puffs and sparks.J Theor Biol. 2008 Aug 7;253(3):483-99. doi: 10.1016/j.jtbi.2008.03.026. Epub 2008 Mar 28. J Theor Biol. 2008. PMID: 18486154
-
Calcium release site ultrastructure and the dynamics of puffs and sparks.Math Med Biol. 2008 Mar;25(1):65-85. doi: 10.1093/imammb/dqn004. Epub 2008 Mar 21. Math Med Biol. 2008. PMID: 18359948
-
Calcium puffs in Xenopus oocytes.Ciba Found Symp. 1995;188:50-60; discussion 60-5. doi: 10.1002/9780470514696.ch4. Ciba Found Symp. 1995. PMID: 7587623 Review.
-
Receptors, sparks and waves in a fire-diffuse-fire framework for calcium release.Prog Biophys Mol Biol. 2004 Jun-Jul;85(2-3):197-216. doi: 10.1016/j.pbiomolbio.2004.01.015. Prog Biophys Mol Biol. 2004. PMID: 15142744 Review.
Cited by
-
Termination of calcium puffs and coupled closings of inositol trisphosphate receptor channels.Cell Calcium. 2014 Sep;56(3):157-68. doi: 10.1016/j.ceca.2014.06.005. Epub 2014 Jun 26. Cell Calcium. 2014. PMID: 25016315 Free PMC article.
-
Frequency and relative prevalence of calcium blips and puffs in a model of small IP₃R clusters.Biophys J. 2014 Jun 3;106(11):2353-63. doi: 10.1016/j.bpj.2014.04.027. Biophys J. 2014. PMID: 24896114 Free PMC article.
-
A stochastic model of calcium puffs based on single-channel data.Biophys J. 2013 Sep 3;105(5):1133-42. doi: 10.1016/j.bpj.2013.07.034. Biophys J. 2013. PMID: 24010656 Free PMC article.
-
Intracellular calcium signals display an avalanche-like behavior over multiple lengthscales.Front Physiol. 2012 Sep 3;3:350. doi: 10.3389/fphys.2012.00350. eCollection 2012. Front Physiol. 2012. PMID: 22969730 Free PMC article.
-
Close agreement between deterministic versus stochastic modeling of first-passage time to vesicle fusion.Biophys J. 2022 Dec 6;121(23):4569-4584. doi: 10.1016/j.bpj.2022.10.033. Epub 2022 Oct 29. Biophys J. 2022. PMID: 36815708 Free PMC article.
References
LinkOut - more resources
Full Text Sources