. 2011:2011:720985.
doi: 10.4061/2011/720985. Epub 2011 Aug 22.

Relative Expression Levels Rather Than Specific Activity Plays the Major Role in Determining In Vivo AKT Isoform Substrate Specificity

Affiliations

Relative Expression Levels Rather Than Specific Activity Plays the Major Role in Determining In Vivo AKT Isoform Substrate Specificity

Rachel S Lee et al. Enzyme Res. 2011.

Abstract

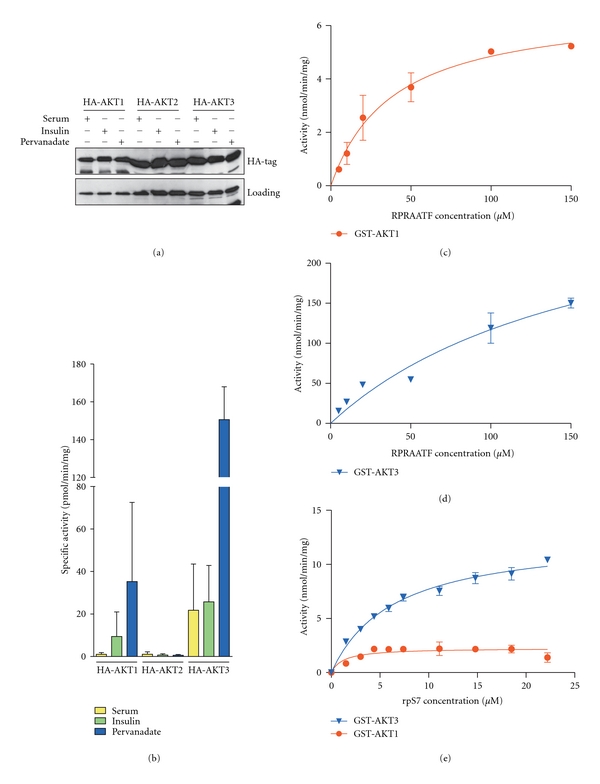
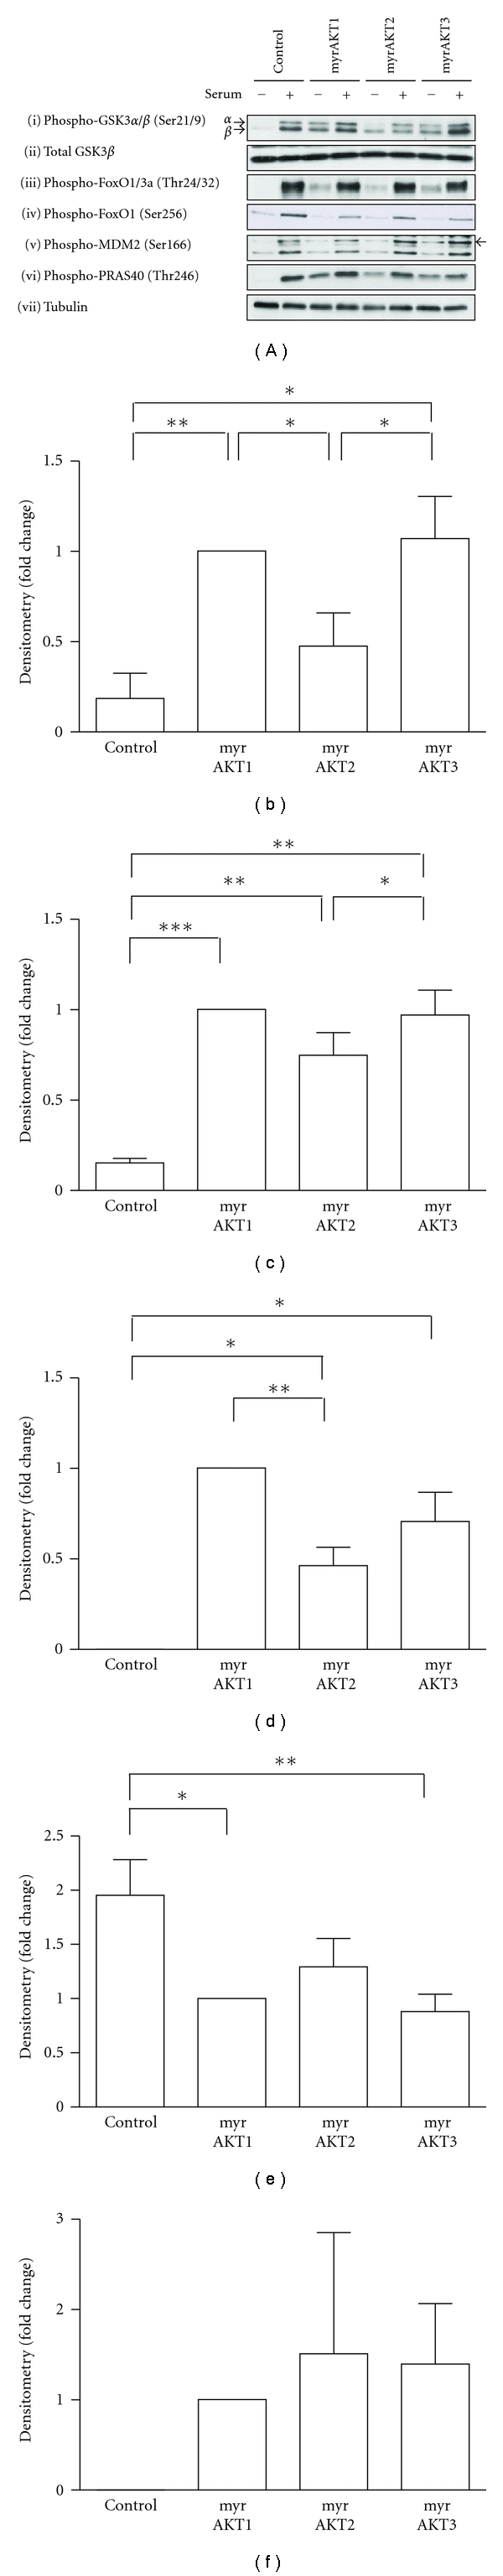
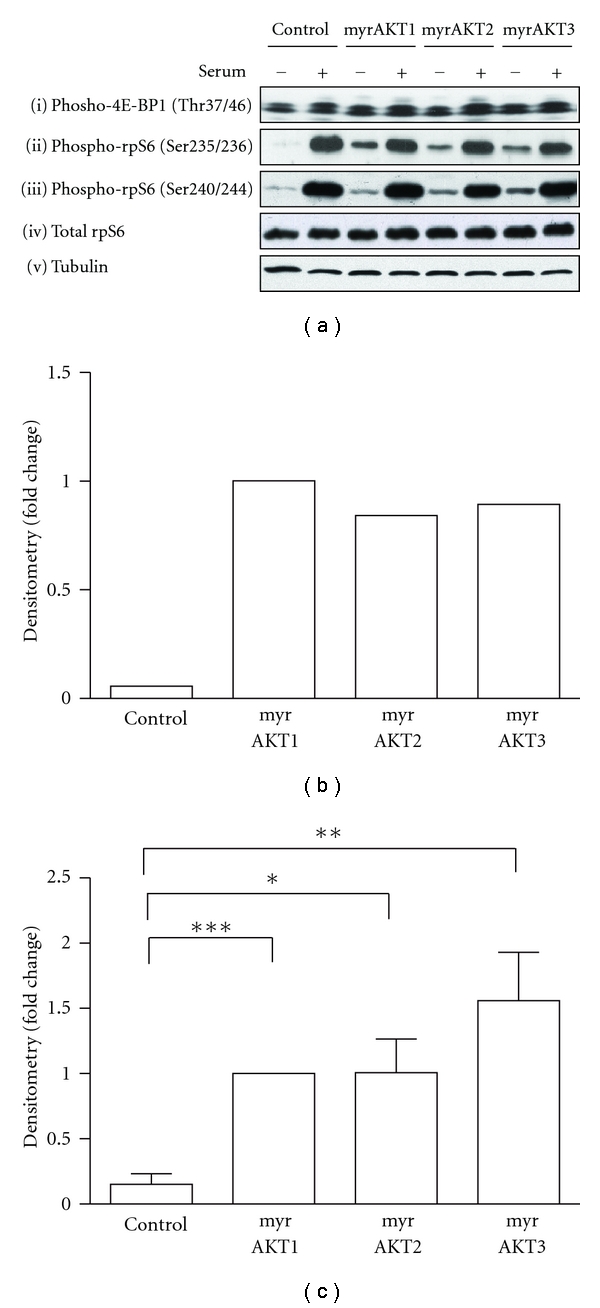
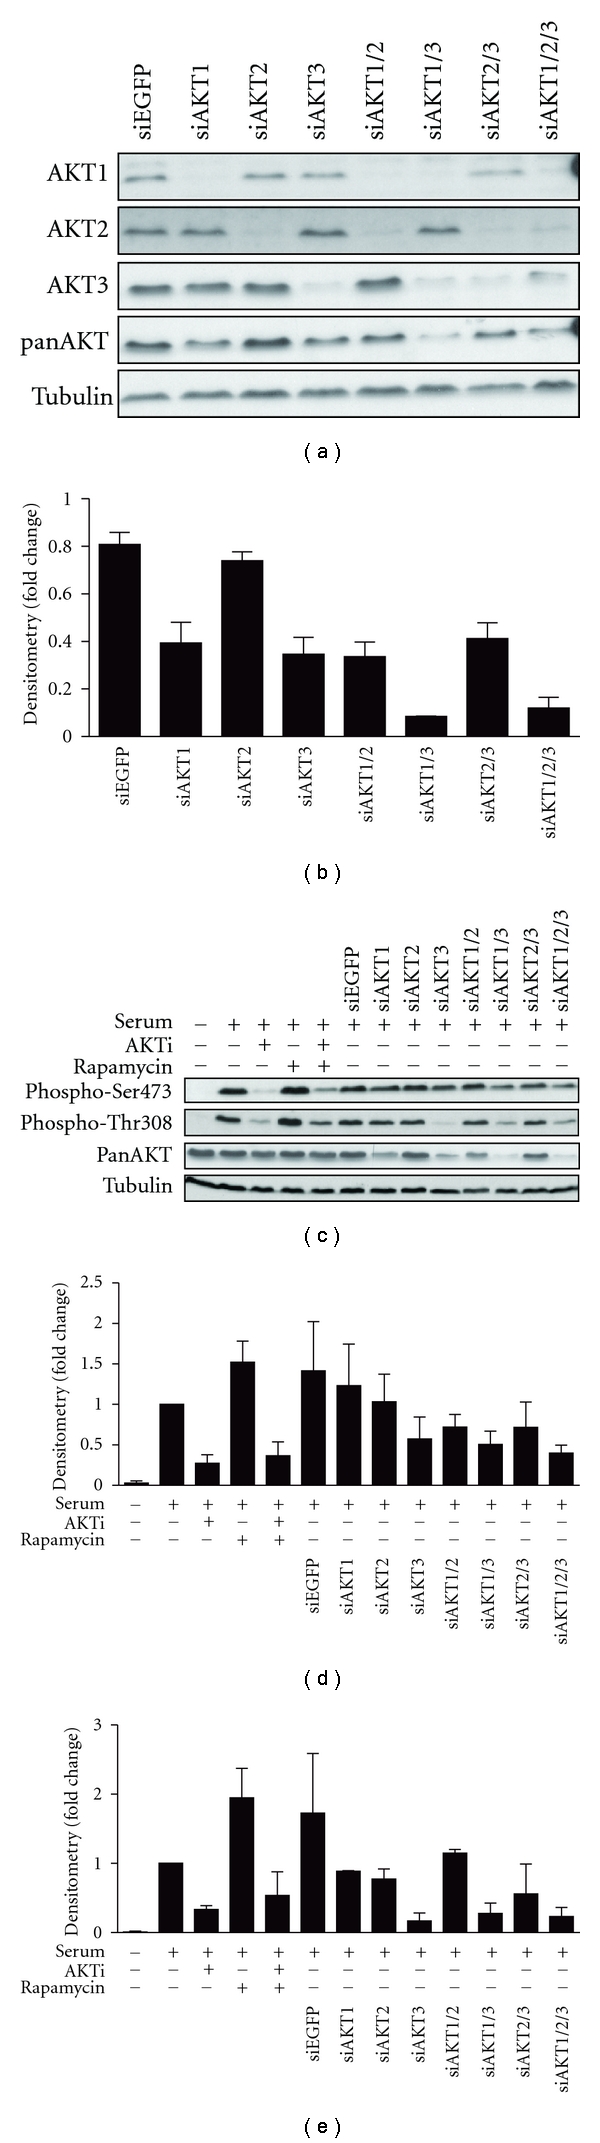
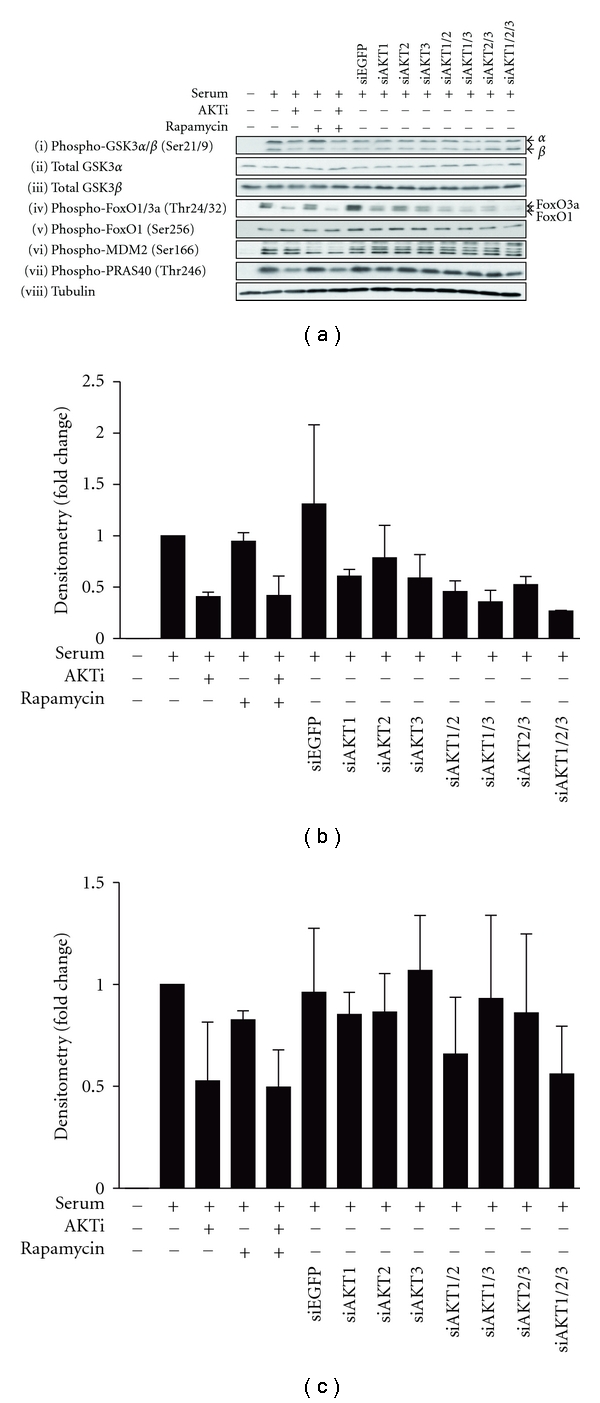
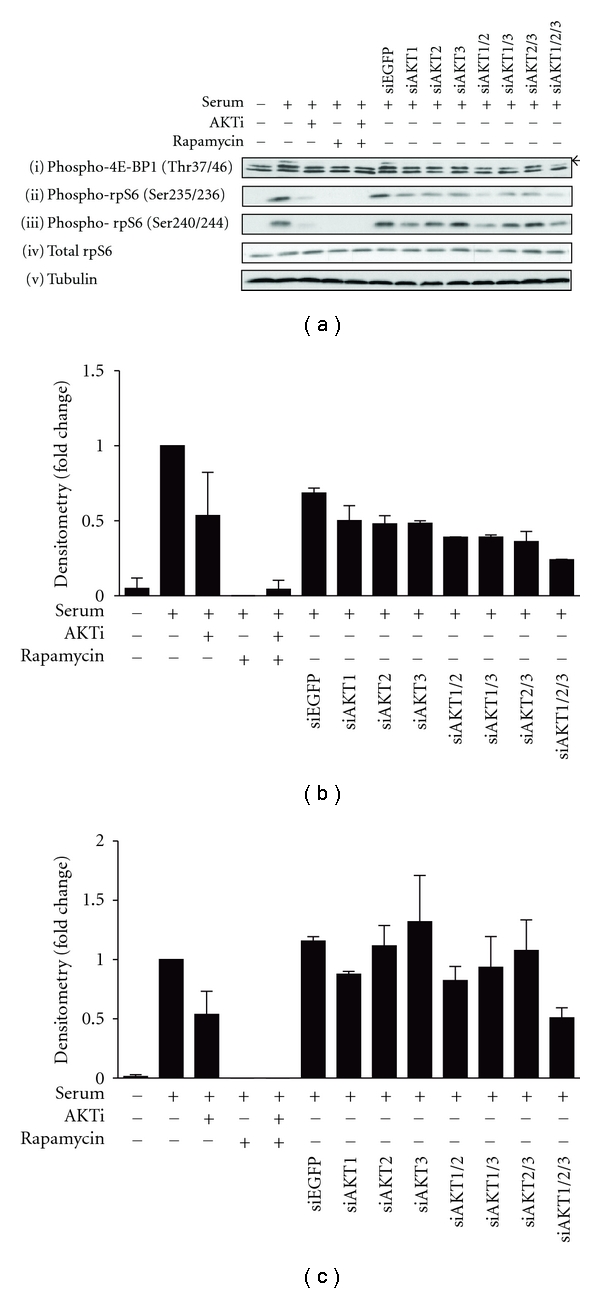
The AKT protooncogene mediates many cellular processes involved in normal development and disease states such as cancer. The three structurally similar isoforms: AKT1, AKT2, and AKT3 exhibit both functional redundancy and isoform-specific functions; however the basis for their differential signalling remains unclear. Here we show that in vitro, purified AKT3 is ∼47-fold more active than AKT1 at phosphorylating peptide and protein substrates. Despite these marked variations in specific activity between the individual isoforms, a comprehensive analysis of phosphorylation of validated AKT substrates indicated only subtle differences in signalling via individual isoforms in vivo. Therefore, we hypothesise, at least in this model system, that relative tissue/cellular abundance, rather than specific activity, plays the dominant role in determining AKT substrate specificity in situ.


Figures

Figure 1
Figure 1
AKT3 is more active than AKT1 towards both the RPRAATF peptide and rpS7 protein substrate. HA-AKT isoforms were expressed in HEK293 cells, stimulated with 10% serum, 1 μM insulin, or 0.1  μM pervanadate and harvested into RLB. (a) expression of HA-AKT isoforms was detected by immunoblotting with the anti-HA antibody. (b) HA-AKT isoforms were immunoprecipitated from cleared protein lysates (100 μg) and assayed towards the RPRAATF peptide for activity. Samples were assayed in duplicate. n = 1–3. Error bars: mean ± SD. GST-AKT1 and GST-AKT3 were expressed in HEK293 cells, stimulated with 0.1 μM pervanadate, and harvested into RLB, then purified by GST-pull down and (c and d) assayed against increasing concentrations of the RPRAATF peptide or (e) rpS7. Data points were fitted to the Michaelis-Menten equation using GraphPad Prism version 5.00, GraphPad Software, San Diego, Calif, USA, http://www.graphpad.com/. n = 1, where samples were assayed in duplicate. Graph shows mean of duplicates.
Figure 2
Figure 2
Comparison of AKT isoform-specific activation in vivo and activity in vitro. HEK293 cells were transfected with the pCDNA3 vector (control) or myrAKT isoforms, serum-starved for 24 hours, then stimulated with 10% serum for 20 minutes. (a) protein lysates (20–50 μg) were separated by SDS-PAGE, transferred onto PVDF membrane, and immunoblotted. Western blots are representative of n = 1–5 experiments. Signals were quantified by densitometry using ImageJ 1.42 q (National Institutes of Health, USA), normalised to loading and expressed as fold change over myrAKT1 serum-starved samples. (b) panAKT. n = 1 (c) HA-tag. (d) phospho-Ser473. (e) phospho-Thr308. (c–e) Serum-starved samples: n = 4, stimulated samples: n = 1. Error bars: mean ± SD. (f) protein lysates (20 μg) were incubated with the RPRAATF peptide substrate in the presence of [γ-32P]ATP at 30°C for 20 minutes to determine total AKT activity. Each sample was assayed in duplicate. Levels of AKT activity are represented as fold change over the serum-starved control sample. n = 2–6, Graph shows mean ± S.D. Statistical analysis was performed using the paired t-test (GraphPad Prism version 5.0, GraphPad Software, San Diego, Calif, USA). Paired t-test was not calculated between serum-starved control and myrAKT1 for (c and e) as the fold difference was the same for all blots quantified. P values >0.05 are not significant, P values 0.01 to 0.05 (*), P values 0.001 to 0.01 (**), and P values <0.001 (***).
Figure 3
Figure 3
Differential isoform-specific signaling to direct AKT substrates in vivo. (a) Protein lysates (20–50 μg) generated from HEK293 cells transfected with the pCDNA3 vector (control), or overexpressing HA-tagged myrAKT isoforms were resolved by SDS-PAGE, transferred onto membrane, and immunoblotted. Western blots are representative of n = 2–5 experiments. Signals from serum-starved samples were quantified by densitometry using ImageJ 1.42q (National Institutes of Health, USA), normalised to loading, and expressed as fold change over myrAKT1 serum-starved samples. (b) phospho-GSK3α (Ser21). n = 5. Error bars: mean ± SEM. (c) phospho-GSK3β (Ser9). n = 5. Error bars: mean ± SEM. (d) phospho-FoxO1/3a (Thr24/32). n = 5. Error bars: mean ± SEM. (e) phospho-FoxO1 (Ser256). N = 5. Error bars: mean ± SEM. (f) phosph-PRAS40 (Thr246). n = 2. Error bars: mean ± SD. Statistical analysis was performed using the paired t-test (GraphPad Prism version 5.0, GraphPad Software, San Diego, Calif, USA). Paired t-test was not calculated between serum-starved control and myrAKT1 for (d) as the fold difference was the same for all blots quantified. P values >0.05 are not significant, P values 0.01 to 0.05 (*), P values 0.001 to 0.01 (**), and P values < 0.001 (***).
Figure 4
Figure 4
Expression of all three AKT isoforms is sufficient for signaling down the mTORC1 pathway. (a) Protein lysates (20–25 μg) generated from HEK293 cells transfected with the pCDNA3 vector (control), or overexpressing HA-tagged myrAKT isoforms were resolved by SDS-PAGE, transferred onto membrane, and immunoblotted. Western blots are representative of n = 1  –5 experiments. Signals from serum-starved samples were quantified by densitometry and normalised to loading and expressed as fold change over myrAKT1 serum-starved samples. (b) phospho-rpS6 (Ser235/236). n = 1. (c) phospho-rpS6 (240/244). n = 5. Error bars: mean ± SEM. Statistical analysis was performed using the paired t-test (GraphPad Prism version 5.0, GraphPad Software, San Diego, Calif, USA). P values >0.05 are not significant, P values 0.01 to 0.05 (*), P values 0.001 to 0.01 (**), and P values < 0.001 (***).
Figure 5
Figure 5
Specific knockdown of endogenous AKT isoforms. HEK293 cells were serum-starved for 24 hours and pretreated with either 5 μM AKTi, 20 nM rapamycin, or both for 30 minutes prior to stimulation with 10% serum for 20 minutes and harvesting into RLB. Endogenous AKT expression was knocked down, either individually or simultaneously, with 25 nM of siRNAs towards specific AKT isoforms and harvested into RLB. siEGFP was used as the control. Protein lysates (20–25 μg) were separated by SDS-PAGE, transferred onto PVDF membrane, and immunoblotted. Western blots are representative of n = 3 experiments. Western blot signals were quantified by densitometry, normalised to loading and expressed as fold change over the serum-stimulated control. (a) Specificity of isoform-specific knockdown and their effects on total AKT expression were analysed by immunoblotting with isoform-specific and panAKT antibodies. (b) panAKT. n = 3. Error bars: mean ± SEM. (c) Total AKT activation levels were analysed by immunoblotting with phospho-Ser473 and phospho-Thr308 antibodies. (d) Phospho-Ser473. n = 3. Error bars: mean ± SEM. (e) Phospho-Thr308. n = 2, Error bars: mean ± SD.
Figure 6
Figure 6
Dependence of AKT isoform-specific expression for signaling down cell proliferation, survival, and growth pathways. (a) HEK293 cells were serum-starved for 24 hours before pretreatment with 5 μM AKTi, 20 nM rapamycin or both for 30 minutes prior to stimulation with 10% serum and harvested into RLB. Expression of endogenous AKT isoforms were knocked down in HEK293 cells, either individually or simultaneously, with 25 nM of siRNAs towards specific AKT isoforms and harvested into RLB. siEGFP was used as the control. Protein lysates (20–25 μg) were separated by SDS-PAGE, transferred onto PVDF membrane, and immunoblotted. Western blots are representative of n = 3 experiments. Intensity of western blot signals were quantified by densitometry, normalised to loading, and expressed as fold change over the serum-stimulated control. (b) phospho-FoxO1/3a (Thr24/32). n = 2. Error bars: mean ± SD. (c) phospho-PRAS40 (Thr246). n = 2. Error bars: mean ± SD.
Figure 7
Figure 7
Effect of AKT expression on activation of the mTORC1 pathway. (a) HEK293 cells were serum-starved for 24 hours before treatment with 5 μM AKTi, 20 nM rapamycin or both for 30 minutes prior to stimulation with 10% FBS and harvested into RLB. Expression of endogenous AKT isoforms were knocked down in HEK293 cells, either individually or simultaneously, with 25 nM of siRNAs towards specific AKT isoforms, and harvested into RLB. siEGFP was used as the control. Protein lysates (20–25 μg) were separated by SDS-PAGE, transferred onto PVDF membrane, and immunoblotted. The arrow indicates the hyperphosphorylated band of phospho-4E-BP1. Western blots are representative of n = 3 experiments. Intensity of western blot signals was quantified by densitometry, normalised to loading and expressed as fold change over the serum-stimulated control. (b) Phospho-rpS6 (Ser235/236). n = 2. Error bars: mean ± SD. (c) Phospho-rpS6 (Ser240/244). n = 3. Error bars: mean ± SEM.
Figure 8
Figure 8
Identification of eEF2 as a potential AKT substrate. HEK293 cells transfected with the pCDNA3 vector (control) or expressing similar levels of myrAKT1 or myrAKT3 were serum-starved for 24 hours prior to harvesting into RLB. Samples were processed in duplicate. Cy2 labelled protein samples (250 μg) were loaded onto 18 cm broad range IPG strips with a nonlinear pH range of 3–11, focused and resolved by SDS-PAGE. After 2DGE, gels were transferred onto Hybond-LFP membrane and then immunoblotted with the PAS antibody and Cy5-conjugated secondary antibody. Membranes were scanned using the Typhoon trio9100 for both Cy2 and Cy5 signals. Cy2 and Cy5 signals were overlayed using ImageQuant (GE Healthcare). Cy2 (total protein) signals are represented in red. Cy5 (PAS) signals are represented in green. Overlayed signals are represented in yellow. (a) control. (b–d) enlarged region of membrane containing control, myrAKT1 or myrAKT3 samples, respectively. Proteins more efficiently phosphorylated by myrAKT1 are circled in white, by myrAKT3 are circled in black, and with equal efficiencies for both are circled in blue. The four protein spots (spots 1–4) were excised from the myrAKT1 Coomassie R-250 stained gel (Supplementary Figure  2) and identified as eEF2 by mass spectrometry analysis (Supplementary Figure  3).  n = 1.

Similar articles

Cited by

References

    1. Kumar CC, Madison V. AKT crystal structure and AKT-specific inhibitors. Oncogene. 2005;24(50):7493–7501. - PubMed
    1. Hanahan D, Weinberg RA. The hallmarks of cancer. Cell. 2000;100(1):57–70. - PubMed
    1. Manning BD, Cantley LC. AKT/PKB Signaling: navigating downstream. Cell. 2007;129(7):1261–1274. - PMC - PubMed
    1. Vivanco I, Sawyers CL. The phosphatidylinositol 3-Kinase AKT pathway in human cancer. Nature Reviews Cancer. 2002;2(7):489–501. - PubMed
    1. Alessi DR, Andjelkovic M, Caudwell B, et al. Mechanism of activation of protein kinase B by insulin and IGF-1. European Molecular Biology Organization Journal. 1996;15(23):6541–6551. - PMC - PubMed

LinkOut - more resources