

Cyclophilin A enhances cell proliferation and tumor growth of liver fluke-associated cholangiocarcinoma
- PMID: 21871105
- PMCID: PMC3173387
- DOI: 10.1186/1476-4598-10-102
Cyclophilin A enhances cell proliferation and tumor growth of liver fluke-associated cholangiocarcinoma
Abstract
Background: Cyclophilin A (CypA) expression is associated with malignant phenotypes in many cancers. However, the role and mechanisms of CypA in liver fluke-associated cholangiocarcinoma (CCA) are not presently known. In this study, we investigated the expression of CypA in CCA tumor tissues and CCA cell lines as well as regulation mechanisms of CypA in tumor growth using CCA cell lines.
Methods: CypA expression was determined by real time RT-PCR, Western blot or immunohistochemistry. CypA silence or overexpression in CCA cells was achieved using gene delivery techniques. Cell proliferation was assessed using MTS assay or Ki-67 staining. The effect of silencing CypA on CCA tumor growth was determined in nude mice. The effect of CypA knockdown on ERK1/2 activation was assessed by Western blot.
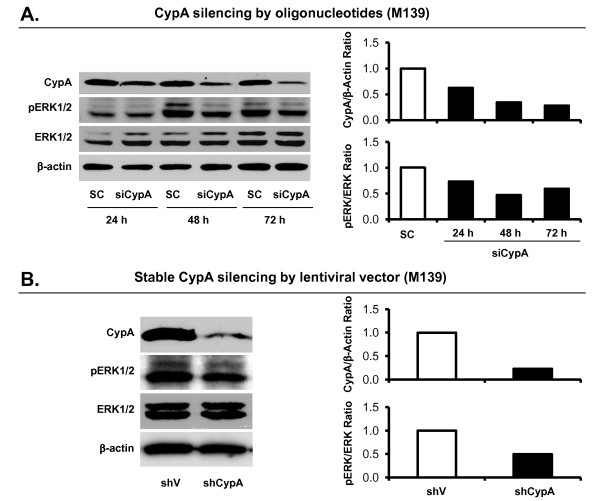
Results: CypA was upregulated in 68% of CCA tumor tissues. Silencing CypA significantly suppressed cell proliferation in several CCA cell lines. Likewise, inhibition of CypA peptidyl-prolyl cis-trans isomerase (PPIase) activity using cyclosporin A (CsA) decreased cell proliferation. In contrast, overexpression of CypA resulted in 30% to 35% increases in proliferation of CCA cell lines. Interestingly, neither silence nor overexpression of CypA affected cell proliferation of a non-tumor human cholangiocyte cell line, MMNK1. Suppression of CypA expression attenuated ERK1/2 activity in CCA M139 cells by using both transient and stable knockdown methods. In the in vivo study, there was a 43% reduction in weight of tumors derived from CypA-silenced CCA cell lines compared with control vector CCA tumors in mice; these tumors with stable CypA silencing showed a reduced cell proliferation.
Conclusions: CypA is upregulated in majority of CCA patients' tissues and confers a significant growth advantage in CCA cells. Suppression of CypA expression decreases proliferation of CCA cell lines in vitro and reduces tumor growth in the nude mouse model. Inhibition of CypA activity also reduces CCA cell proliferation. The ERK1/2 pathway may be involved in the CypA-mediated CCA cell proliferation. Thus, CypA may represent an important new therapeutic target for liver fluke-associated CCA.
Figures


Similar articles
-
Secreted cyclophilin A mediates G1/S phase transition of cholangiocarcinoma cells via CD147/ERK1/2 pathway.Tumour Biol. 2015 Feb;36(2):849-59. doi: 10.1007/s13277-014-2691-5. Epub 2014 Oct 10. Tumour Biol. 2015. PMID: 25296734
-
Overexpression of microRNA-21 regulating PDCD4 during tumorigenesis of liver fluke-associated cholangiocarcinoma contributes to tumor growth and metastasis.Tumour Biol. 2013 Jun;34(3):1579-88. doi: 10.1007/s13277-013-0688-0. Epub 2013 Feb 17. Tumour Biol. 2013. PMID: 23417858
-
Suppression of thymosin β10 increases cell migration and metastasis of cholangiocarcinoma.BMC Cancer. 2013 Sep 23;13:430. doi: 10.1186/1471-2407-13-430. BMC Cancer. 2013. PMID: 24053380 Free PMC article.
-
Liver Fluke-Associated Biliary Tract Cancer.Gut Liver. 2018 May 15;12(3):236-245. doi: 10.5009/gnl17102. Gut Liver. 2018. PMID: 28783896 Free PMC article. Review.
-
Potential targeted therapy for liver fluke associated cholangiocarcinoma.J Hepatobiliary Pancreat Sci. 2014 Jun;21(6):362-70. doi: 10.1002/jhbp.65. Epub 2014 Jan 10. J Hepatobiliary Pancreat Sci. 2014. PMID: 24408866 Review.
Cited by
-
Cyclophilin A is required for efficient human cytomegalovirus DNA replication and reactivation.J Gen Virol. 2012 Apr;93(Pt 4):722-732. doi: 10.1099/vir.0.037309-0. Epub 2012 Jan 13. J Gen Virol. 2012. PMID: 22238232 Free PMC article.
-
Cyclosporin A-Based PROTACs Can Deplete Abundant Cellular Cyclophilin A without Suppressing T Cell Activation.Molecules. 2024 Jun 11;29(12):2779. doi: 10.3390/molecules29122779. Molecules. 2024. PMID: 38930843 Free PMC article.
-
Pathogenesis, diagnosis, and management of cholangiocarcinoma.Gastroenterology. 2013 Dec;145(6):1215-29. doi: 10.1053/j.gastro.2013.10.013. Epub 2013 Oct 15. Gastroenterology. 2013. PMID: 24140396 Free PMC article. Review.
-
Animal models of cholangiocarcinoma.Biochim Biophys Acta Mol Basis Dis. 2019 May 1;1865(5):982-992. doi: 10.1016/j.bbadis.2018.03.026. Epub 2018 Apr 5. Biochim Biophys Acta Mol Basis Dis. 2019. PMID: 29627364 Free PMC article. Review.
-
Single-cell analyses reveal metastasis mechanism and microenvironment remodeling of lymph node in intrahepatic cholangiocarcinoma.JHEP Rep. 2024 Nov 15;7(3):101275. doi: 10.1016/j.jhepr.2024.101275. eCollection 2025 Mar. JHEP Rep. 2024. PMID: 40041119 Free PMC article.
References
-
- Sonakul D, Koompirochana C, Chinda K, Stitnimakarn T. Hepatic carcinoma with opisthorchiasis. Southeast Asian J Trop Med Public Health. 1978;9:215–219. - PubMed
-
- Khan SA, Taylor-Robinson SD, Carmichael PL, Habib N, Lemoine NR, Thomas HC. Analysis of p53 mutations for a mutational signature in human intrahepatic cholangiocarcinoma. Int J Oncol. 2006;28:1269–1277. - PubMed
Publication types
MeSH terms
Substances
Grants and funding
LinkOut - more resources
Full Text Sources
Other Literature Sources
Medical
Molecular Biology Databases
Research Materials
Miscellaneous
