. 2011 Dec;152(6):941-953.e1.
doi: 10.1016/j.ajo.2011.05.023. Epub 2011 Aug 25.

Assessment of corneal thickness and keratocyte density in a rabbit model of laser in situ keratomileusis using scanning laser confocal microscopy

Affiliations

Assessment of corneal thickness and keratocyte density in a rabbit model of laser in situ keratomileusis using scanning laser confocal microscopy

Michael D Twa et al. Am J Ophthalmol. 2011 Dec.

Abstract

Purpose: To determine the repeatability of corneal thickness and keratocyte density using in vivo confocal scanning laser microscopy in a rabbit model of laser in situ keratomileusis.

Design: Prospective, experimental animal study.

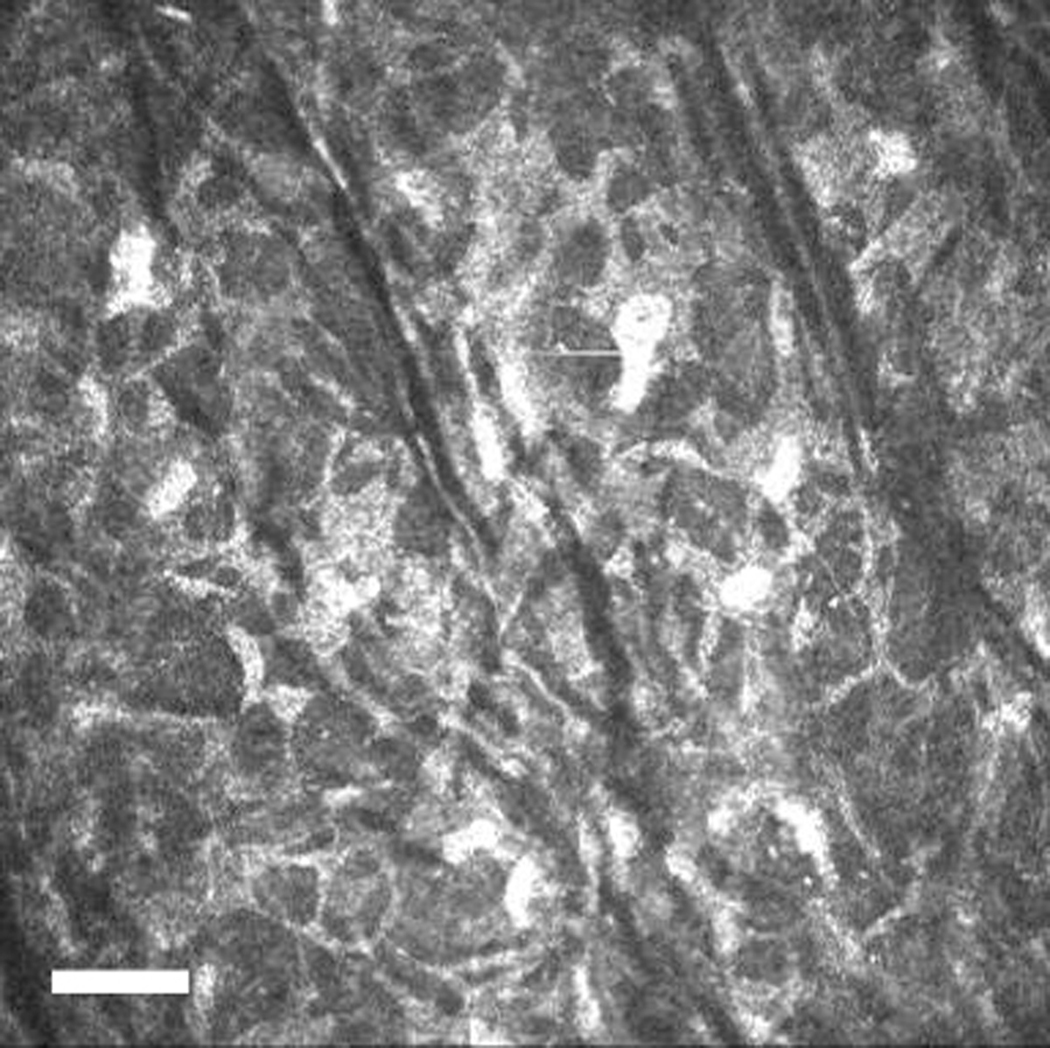
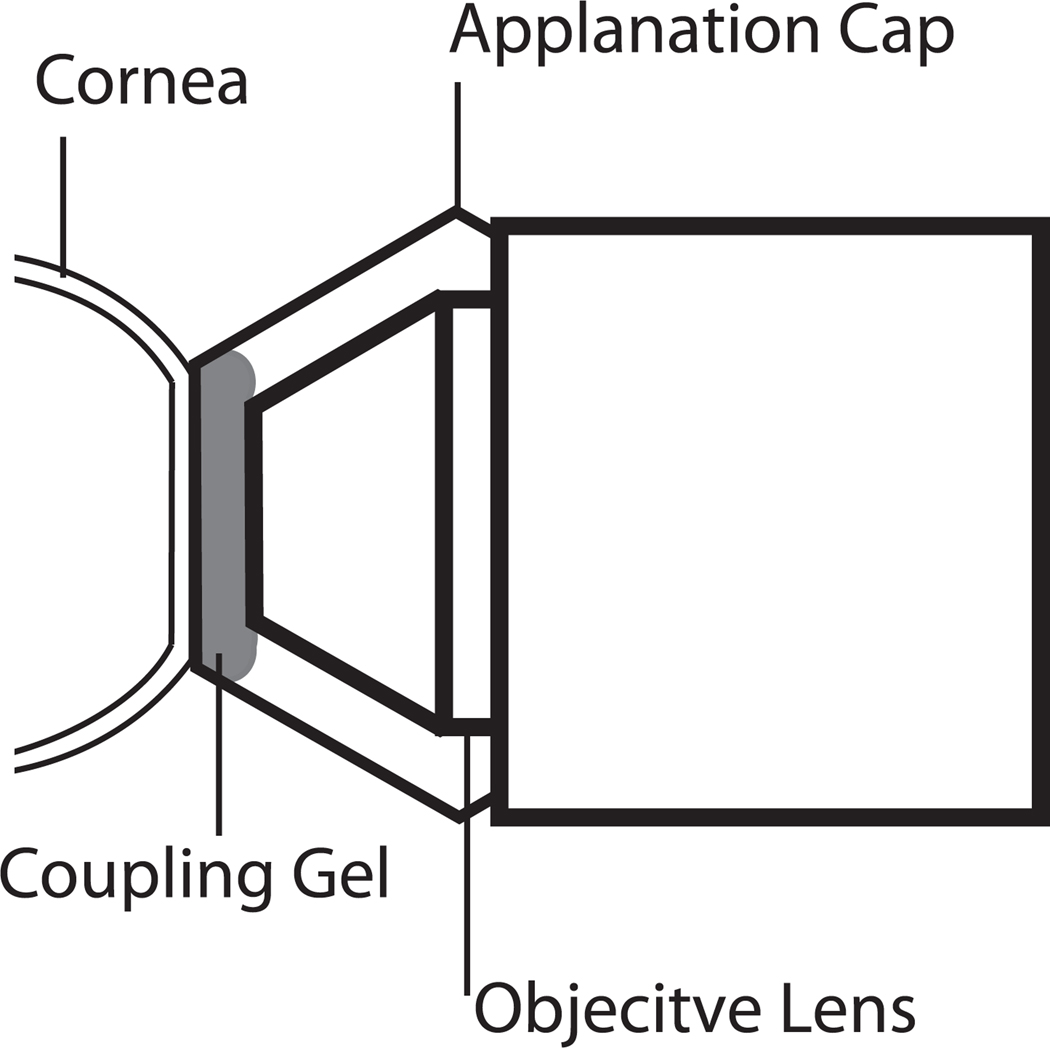
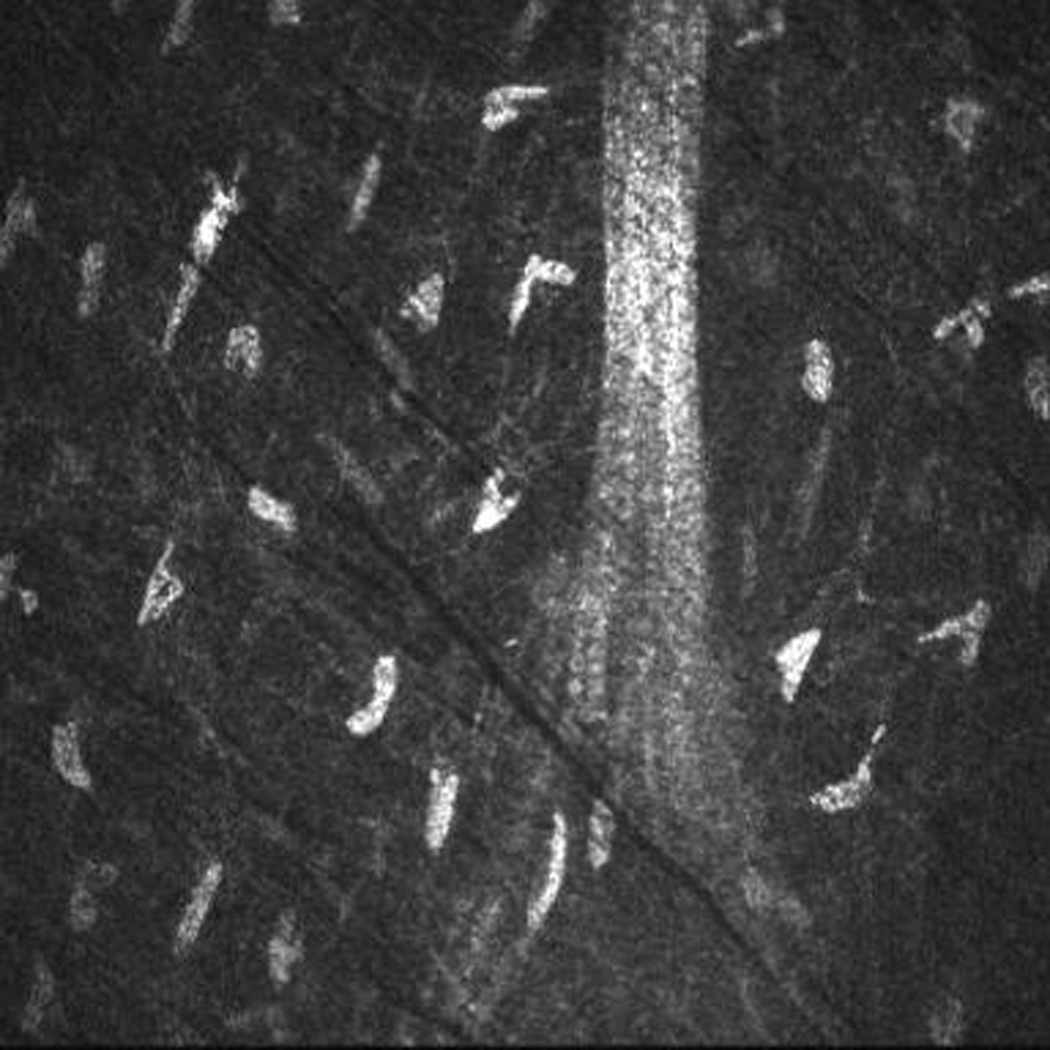
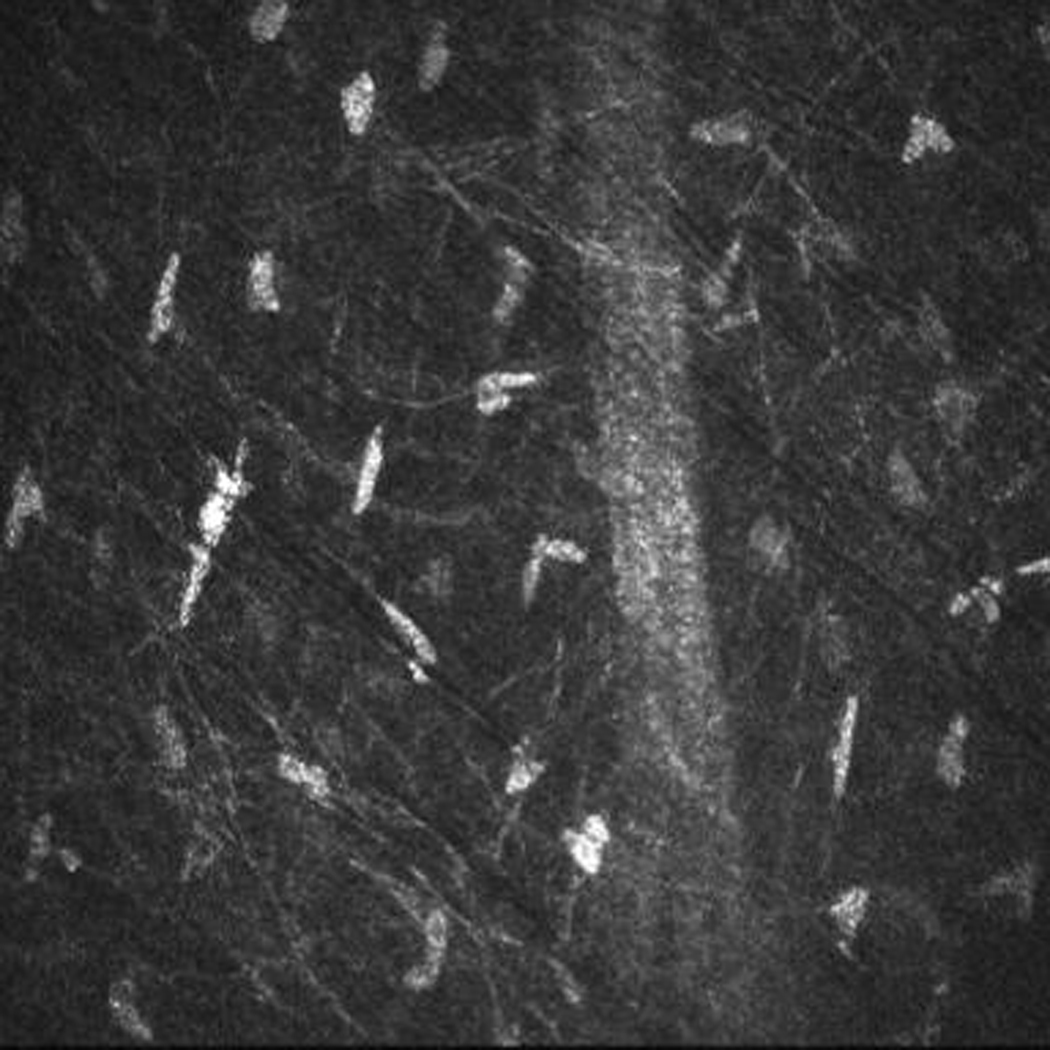
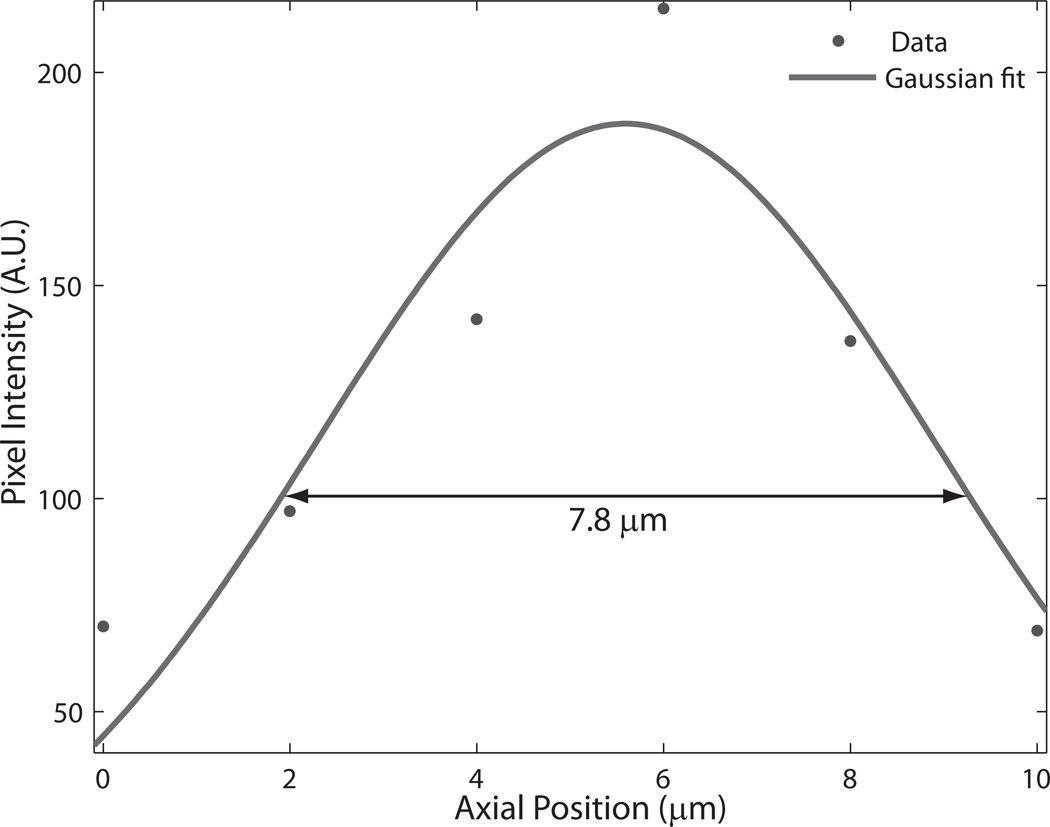
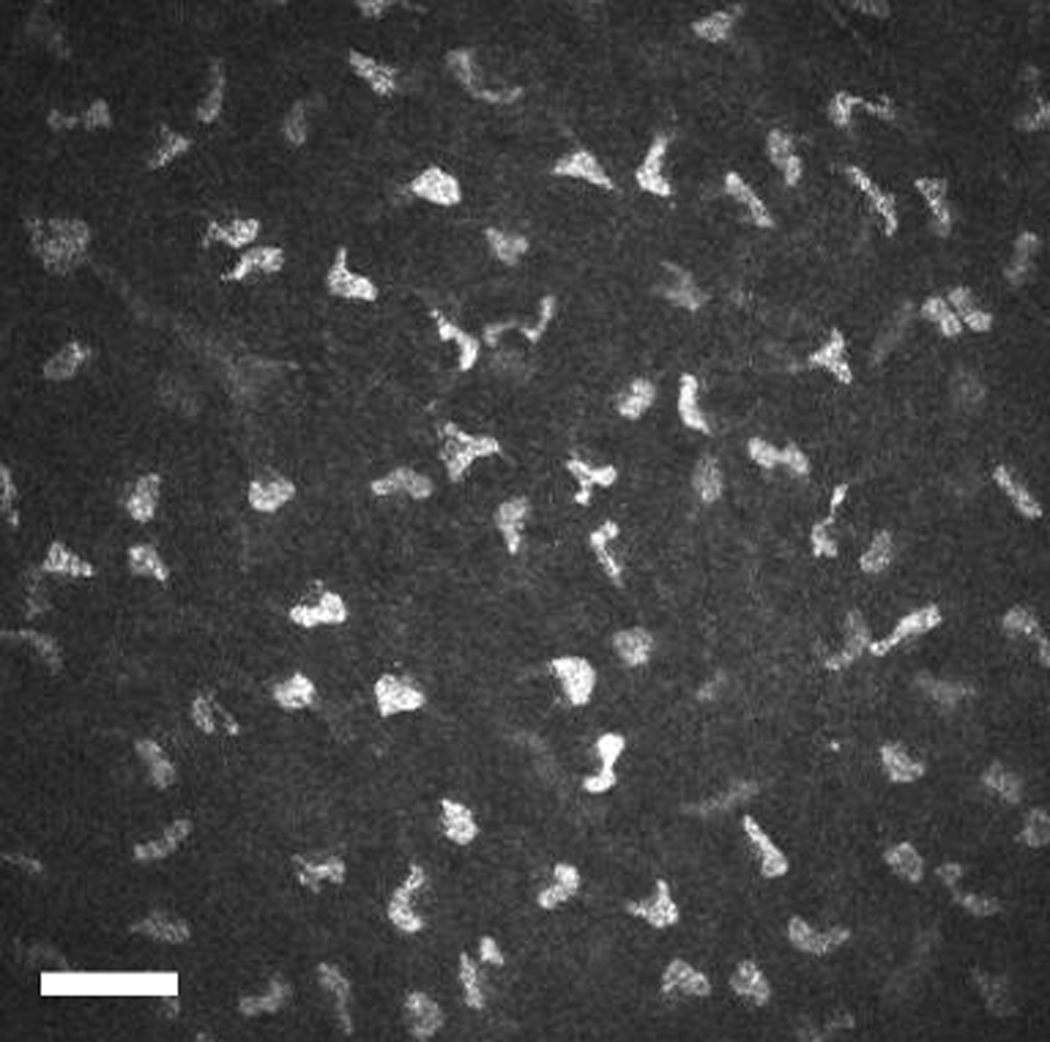
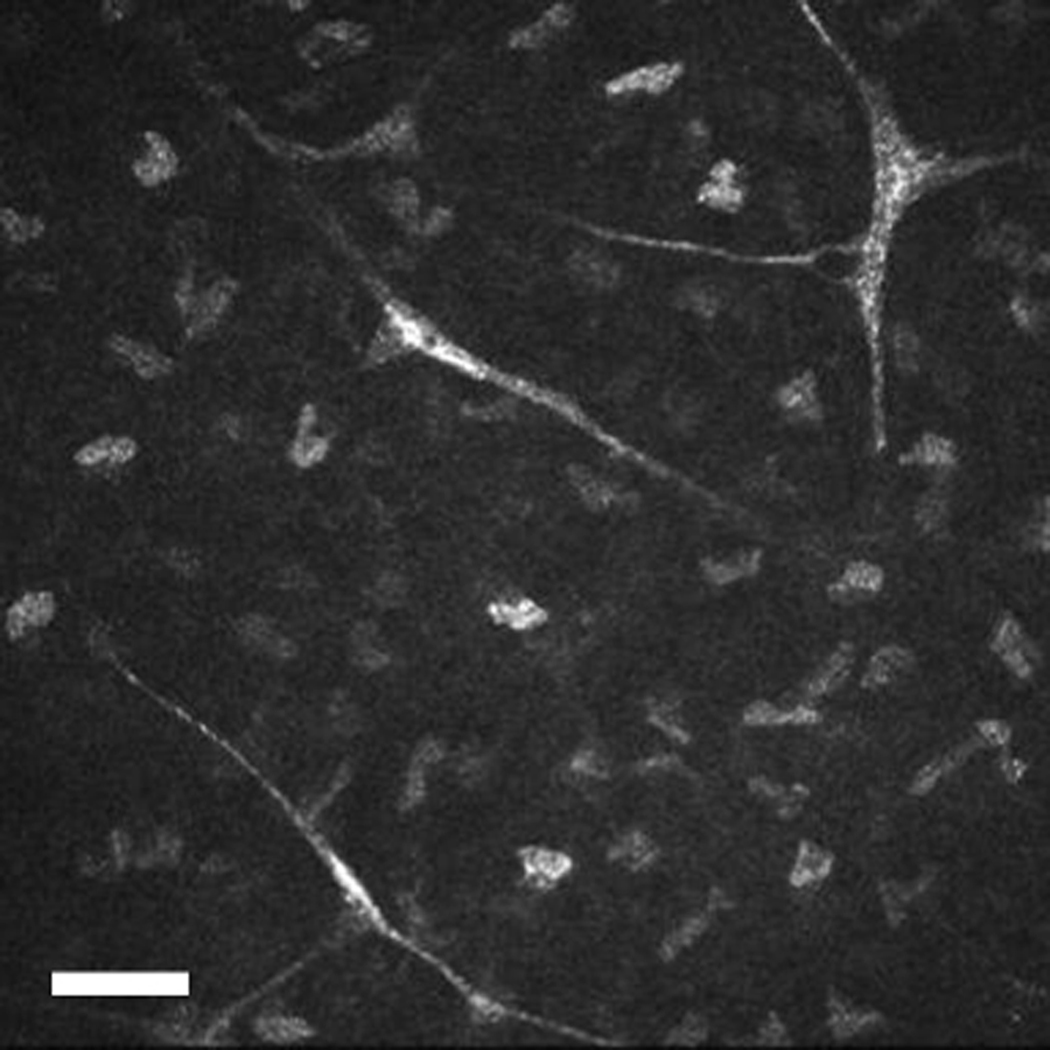
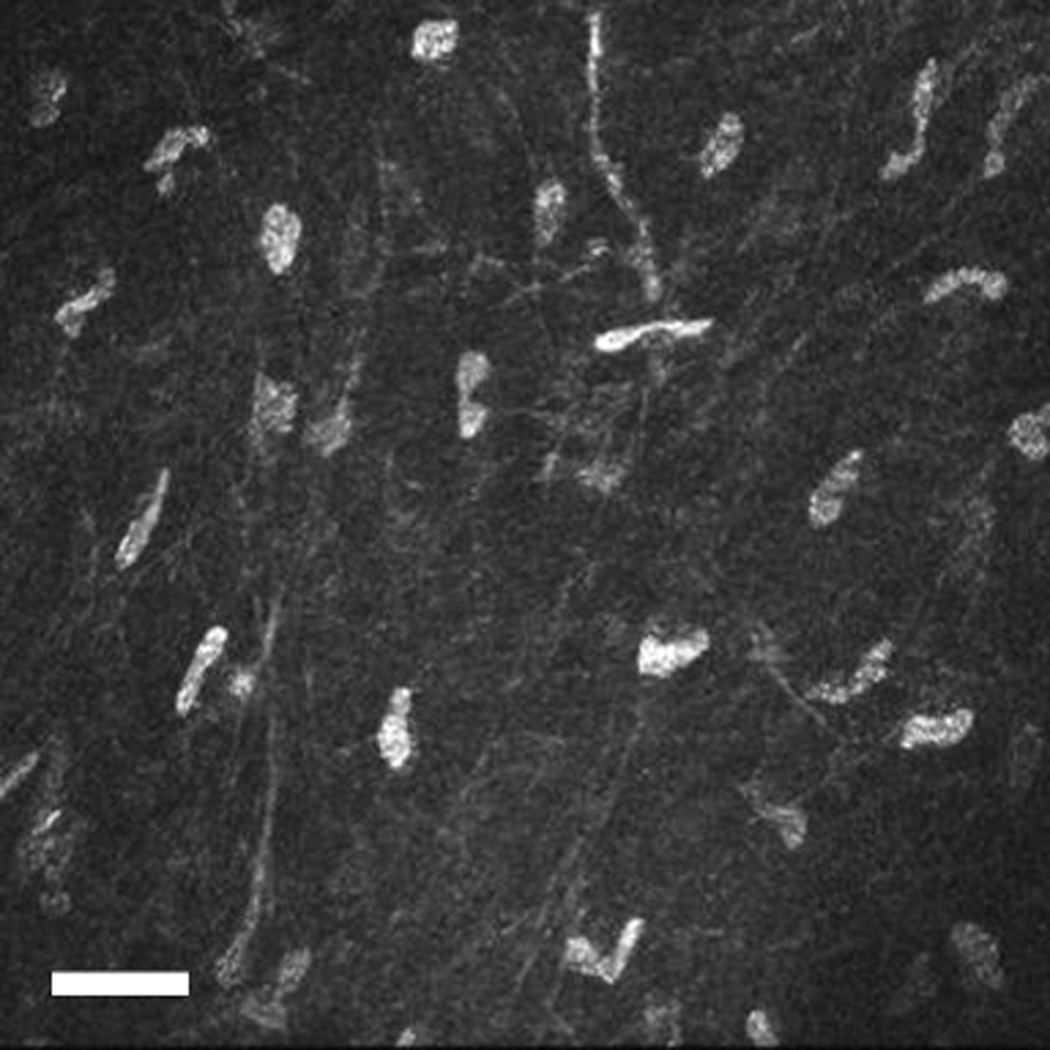
Methods: En face tomographic images of corneal tissue were captured from 5 New Zealand white rabbits. Central corneal thickness was compared with conventional ultrasonic pachymetry. Keratocyte density was measured as a function of stromal depth at baseline and 6 weeks after a 130-μm lamellar incision in the following regions: first countable stromal image (30 to 39 μm), anterior stroma (40 to 75 μm), incision zone (76 to 150 μm), mid stroma (151 to 250 μm), and deep stroma (251 to 400 μm).

Results: The mean residual difference between ultrasonic and confocal corneal thickness measurements was 2.1 μm (95% confidence interval [CI], -7.0 to 11.2 μm; P = .61). Before the lamellar incision, keratocyte density was highest in the first countable frame of the anterior stroma, 53 800 cells/mm(3) (95% CI, 35 000 to 72 000 cells/mm(3)) and was least in deep stroma, 27 100 cells/mm(3) (95% CI, 22 400 to 32 000 cells/mm(3)). Six weeks after stromal lamellar incision, keratocyte density was unchanged in the first countable frame of the anterior stroma, 43 700 cells/mm(3) (95% CI, 31 800 to 55 500 cells/mm(3); P = .29). There were no changes in cell density in deeper stromal regions.

Conclusions: There was excellent agreement between ultrasonic and confocal microscopy measurements of corneal thickness. In vivo repeatability of keratocyte density estimation using scanning laser confocal microscopy is comparable with the results of previous reports using tandem-scanning confocal microscopy. Keratocyte density was more varied, but not significantly different, in the anterior-most corneal stroma 6 weeks after a lamellar incision.


Figures

Figure 1
Figure 1
Cross sectional and en face in vivo confocal microscopy images of the rabbit cornea before and after lamellar incision. Axial cross section of the cornea showing the corneal epithelium (white arrow), basement membrane (black arrow), anterior stroma (*) and lamellar incision zone as the diffuse speckled region in the lower right portion of the image (left); Tangential (en face) section of the anterior corneal stroma before treatment (middle); six weeks after a 130 µm deep lamellar incision, keratocytes are more numerous and irregular in shape with highly reflective nuclei and visible cytoplasm revealing cell-cell junctions (right). Microscopic folds are also visible in the stroma. Scale bar = 50 µm.
Figure 1
Figure 1
Cross sectional and en face in vivo confocal microscopy images of the rabbit cornea before and after lamellar incision. Axial cross section of the cornea showing the corneal epithelium (white arrow), basement membrane (black arrow), anterior stroma (*) and lamellar incision zone as the diffuse speckled region in the lower right portion of the image (left); Tangential (en face) section of the anterior corneal stroma before treatment (middle); six weeks after a 130 µm deep lamellar incision, keratocytes are more numerous and irregular in shape with highly reflective nuclei and visible cytoplasm revealing cell-cell junctions (right). Microscopic folds are also visible in the stroma. Scale bar = 50 µm.
Figure 2
Figure 2
Configuration of the objective and applanation lenses of the Rostock cornea module. The objective lens is coupled to a PMMA cap using a viscous coupling solution. During confocal scanning, the outer surface of the PMMA cap applanates the corneal surface and may be moistened with additional coupling solution placed between the PMMA cap and cornea.
Figure 3
Figure 3
Image of a lateral magnification calibration target acquired with the Rostock Corneal Module. Divisions are 10µm apart. Nominal scaling factor of 1µm/pixel was measured as 1.04µm / pixel horizontally and 1.01µm/pixel vertically. Illumination was uniform across the field. Scale bar=50µm.
Figure 4
Figure 4
Sequential tomographic sections from confocal microscopy of the rabbit cornea. Anterior (top left) to posterior (bottom right) sequential depth scan through the mid stromal region. A nerve fiber bundle is evident in the center of the image for reference. Keratocyte nuclei are bright, oval and circular spots scattered throughout the field. Scale bar = 50 µm.
Figure 4
Figure 4
Sequential tomographic sections from confocal microscopy of the rabbit cornea. Anterior (top left) to posterior (bottom right) sequential depth scan through the mid stromal region. A nerve fiber bundle is evident in the center of the image for reference. Keratocyte nuclei are bright, oval and circular spots scattered throughout the field. Scale bar = 50 µm.
Figure 5
Figure 5
Correlation between PMMA calibration lens image thickness and measured thickness using scanning laser confocal microscopy. Lens image thickness was adjusted for differences in the index of refraction at each interface–objective lens and coupling solution, coupling solution and PMMA cap, and PMMA cap and cornea (see Figure 2). Regression equation provides linear calibration parameters needed to adjust measured image values to object thickness. Dashed line is the reference 1:1 line.
Figure 6
Figure 6
Pixel intensity as a function of axial position from corneal confocal microscopy in the rabbit. Axial depth of field is determined by the width of the fitted function at half the maximum height. Observations are shown as points and data is fitted with a Gaussian function (R2=0.85; Full width at half maximum height = 7.8 µm).
Figure 7
Figure 7
Residual difference between total corneal thicknesses measured ultrasonically and by scanning laser confocal microscopy in the rabbit. Solid line is the identity line (perfect agreement); dashed line is the mean difference (2.1µm); dotted lines are the upper (27.3µm) and lower (−23.0µm) 95% limits of agreement.
Figure 8
Figure 8
Measured keratocyte density in the rabbit as a function of tissue depth. Cell density as a function of tissue depth is plotted from the anterior to mid-stroma (top). The polynomial regression line is plotted along with the 95% prediction interval. Representative examples of keratocyte density by stromal region are shown beneath the plot by increasing depth from left to right: First countable frame (left, 35µm), anterior stroma (middle left, 70µm), incision zone (middle right, 130µm), and deep stroma (bottom right, 380µm). Scale bar = 50 µm.
Figure 8
Figure 8
Measured keratocyte density in the rabbit as a function of tissue depth. Cell density as a function of tissue depth is plotted from the anterior to mid-stroma (top). The polynomial regression line is plotted along with the 95% prediction interval. Representative examples of keratocyte density by stromal region are shown beneath the plot by increasing depth from left to right: First countable frame (left, 35µm), anterior stroma (middle left, 70µm), incision zone (middle right, 130µm), and deep stroma (bottom right, 380µm). Scale bar = 50 µm.
Figure 9
Figure 9
Box-plot comparison of keratocyte density in the rabbit before and after the stromal lamellar incision. Keratocyte density is given by stromal region before and six weeks after a 130 µm deep lamellar incision. First is defined as the first countable frame (30–39µm deep); Anterior stroma =40–75µm; Incision zone=76–150µm; Middle stroma=151–250; Deep stroma=251–400µm.
Figure 10
Figure 10
Within-session repeatability of keratocyte density measurements in the rabbit before and after lamellar corneal incision. Residual difference in keratocyte density measurements between two separate measurements obtained within a single examination session before a corneal lamellar incision (top) and 6 weeks following a corneal lamellar incision (bottom). The difference between repeated measurements are plotted a function of the average of paired measurements. Total residual differences are shown as the mean (dashed line) ± 1.96 SD interval (dash-dot lines). Measurements for each stromal region (e.g. anterior, middle, deep) are indicated by symbols in the legend. First is defined as the first countable frame (30–39µm deep); Anterior stroma =40–75µm; Incision zone=76–150µm; Middle stroma=151–250; Deep stroma=251–400µm.
Figure 10
Figure 10
Within-session repeatability of keratocyte density measurements in the rabbit before and after lamellar corneal incision. Residual difference in keratocyte density measurements between two separate measurements obtained within a single examination session before a corneal lamellar incision (top) and 6 weeks following a corneal lamellar incision (bottom). The difference between repeated measurements are plotted a function of the average of paired measurements. Total residual differences are shown as the mean (dashed line) ± 1.96 SD interval (dash-dot lines). Measurements for each stromal region (e.g. anterior, middle, deep) are indicated by symbols in the legend. First is defined as the first countable frame (30–39µm deep); Anterior stroma =40–75µm; Incision zone=76–150µm; Middle stroma=151–250; Deep stroma=251–400µm.

References

    1. Honda N, Miyai T, Nejima R, et al. Effect of latanoprost on the expression of matrix metalloproteinases and tissue inhibitor of metalloproteinase 1 on the ocular surface. Arch Ophthalmol. 2010;128(4):466–471. - PubMed
    1. Erie JC, Patel SV, McLaren JW, Hodge DO, Bourne WM. Corneal keratocyte deficits after photorefractive keratectomy and laser in situ keratomileusis. Am J Ophthalmol. 2006;141(5):799–809. - PubMed
    1. Knappe S, Stachs O, Zhivov A, Hovakimyan M, Guthoff R. Results of confocal microscopy examinations after collagen cross-linking with riboflavin and uva light in patients with progressive keratoconus. Ophthalmologica. 2011;225(2):95–104. - PubMed
    1. Hovakimyan M, Guthoff R, Knappe S, et al. Short-term corneal response to cross-linking in rabbit eyes assessed by in vivo confocal laser scanning microscopy and histology. Cornea. 2011;30(2):196–203. - PubMed
    1. de Benito Llopis L, Drake P, Canadas P, Hernandez-Verdejo JL, Teus MA. Keratocyte density after laser-assisted subepithelial keratectomy with mitomycin c. Am J Ophthalmol. 2010;150(5):642–649. - PubMed

Publication types