Guideline
. 2011 Sep-Oct;44(5):544-54.
doi: 10.1016/j.jelectrocard.2011.06.008.

A detailed guide for quantification of myocardial scar with the Selvester QRS score in the presence of electrocardiogram confounders

Affiliations
Guideline

A detailed guide for quantification of myocardial scar with the Selvester QRS score in the presence of electrocardiogram confounders

Zak Loring et al. J Electrocardiol. 2011 Sep-Oct.

Abstract

The Selvester QRS score translates subtle changes in ventricular depolarization measured by the electrocardiogram into information about myocardial scar location and size. This estimated scar has been shown to have a high degree of correlation with autopsy-measured myocardial infarct size. In addition, multiple studies have demonstrated the value of the QRS score in post-myocardial infarct patients to provide prognostic information. Recent studies have demonstrated that increasing QRS score is predictive of increased implantable defibrillator shocks for ventricular tachycardia and fibrillation as well as decreased response to cardiac resynchronization therapy. Although QRS scoring has never achieved widespread clinical use, increased interest in patient selection and risk-stratification techniques for implantable defibrillators and cardiac resynchronization therapy has led to renewed interest in QRS scoring and its potential to identify which patients will benefit from device therapy. The QRS score criteria were updated in 2009 to expand their use to a broader population by accounting for the different ventricular depolarization sequences in patients with bundle-branch/fascicular blocks or ventricular hypertrophy. However, these changes also introduced additional complexity and nuance to the scoring procedure. This article provides detailed instructions and examples on how to apply the QRS score criteria in the presence of confounding conduction types to facilitate understanding and enable development and application of automated QRS scoring.


Figures

Figure 1
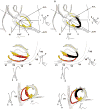
Figure 1. LBBB activation patterns
All panels demonstrate the ventricular activation pattern in LBBB and ECG wave forms as seen from the frontal plane (top), horizontal plane (middle) and sagittal plane (bottom) in LBBB without infarction (A), LBBB with anteroseptal infarction (B), LBBB with posterolateral infarction (C) and LBBB with inferior infarction (D). Colored lines represent areas of myocardium activated within the same 10-millisecond period (isochrones). Numbers represent milliseconds since beginning of activation. Key ECG changes include the development of large R waves in V1–V2 with anteroseptal infarction (B), increased R/R’ amplitude ratios in V5–V6 with apical infarction (B), increased S/S’ amplitude ratios in V1–V2 with posterolateral infarction (C) and Q waves and decreased R/Q or R/S in aVF amplitude ratios with inferior infarction (D).
Figure 2
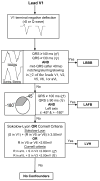
Figure 2. Flow chart for determining left conduction/hypertrophy type abnormality
This chart describes the sequence in which ECGs are evaluated for conduction type when the terminal deflection in V1 is negative (rS or Q wave).
Figure 3
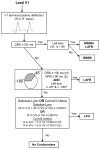
Figure 3. Flow chart for determining left conduction/hypertrophy type abnormality
This chart describes the sequence in which ECGs are evaluated for conduction type when the terminal deflection in V1 is positive (R or R’ wave).
Figure 4
Figure 4. Flow chart for determining RAO
After conduction type is determined by following Figure 2 or Figure 3, all ECGs are evaluated for presence of right atrial overload (RAO) which suggests accompanying right ventricular hypertrophy (RVH).
Figure 5
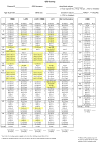
Figure 5. QRS Scoring Sheet
Sample QRS scoring sheet with all conduction types and criteria listed. After demographic information is entered in the top portion, conduction type is selected and analysis proceeds down the appropriate column.
Figure 6
Figure 6. “Selecting” and “weighting” example
Criteria for an example lead are shown. Boxes are delineated by dotted lines, check marks and X’s indicate which criteria are satisfied, and circles indicate criteria that are selected and contribute to the overall score for the lead. The Q ≥ 20 ms criterion is met yielding 1 point for the top box in this lead. Proceeding from the top down to the next box, the next criterion that is met is R/S ≤ 0.5 yielding 2 points (no point value is listed directly to the right of this criterion; therefore, its point value is equal to that of the criterion directly above it). Even though two additional criteria are met (R/S ≤ 1 and R ≤ 0.5 mV), only the single criterion within each box that is closest to the top of the box is selected.
Figure 7
Figure 7. QRS score example
The ECG and completed QRS score sheet are shown for a 45 year old male with a QRS score of 7.

References

    1. Selvester R, Wagner J, Rubin H. Quantitation of myocardial infarct size and location by electrocardiogram and vectorcardiogram. Quantitation in cardiology. 1972:31.
    1. Strauss DG, Selvester RH, Lima JA, et al. ECG quantification of myocardial scar in cardiomyopathy patients with or without conduction defects: correlation with cardiac magnetic resonance and arrhythmogenesis. Circ Arrhythm Electrophysiol. 2008;1:327–36. - PMC - PubMed
    1. Strauss DG, Cardoso S, Lima JA, Rochitte CE, Wu KC. ECG scar quantification correlates with cardiac magnetic resonance scar size and prognostic factors in Chagas' disease. Heart. 2011;97:357–61. - PubMed
    1. Wagner GS, Freye CJ, Palmeri ST, et al. Evaluation of a QRS scoring system for estimating myocardial infarct size. I. Specificity and observer agreement. Circulation. 1982;65:342–7. - PubMed
    1. Ideker RE, Wagner GS, Ruth WK, et al. Evaluation of a QRS scoring system for estimating myocardial infarct size. II. Correlation with quantitative anatomic findings for anterior infarcts. Am J Cardiol. 1982;49:1604–14. - PubMed

Publication types

MeSH terms