

Molecular imaging with optical coherence tomography using ligand-conjugated microparticles that detect activated endothelial cells: rational design through target quantification
- PMID: 21872249
- PMCID: PMC3234340
- DOI: 10.1016/j.atherosclerosis.2011.07.127
Molecular imaging with optical coherence tomography using ligand-conjugated microparticles that detect activated endothelial cells: rational design through target quantification
Abstract
Objectives: Optical coherence tomography (OCT) is a high resolution imaging technique used to assess superficial atherosclerotic plaque morphology. Utility of OCT may be enhanced by contrast agents targeting molecular mediators of inflammation.
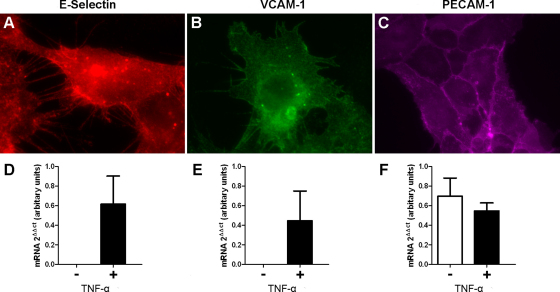
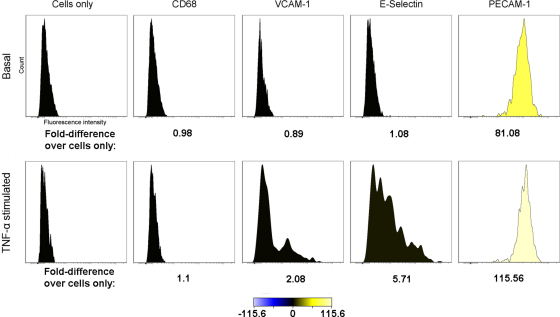
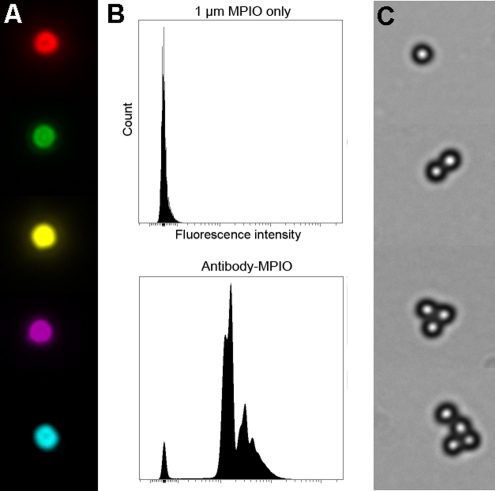
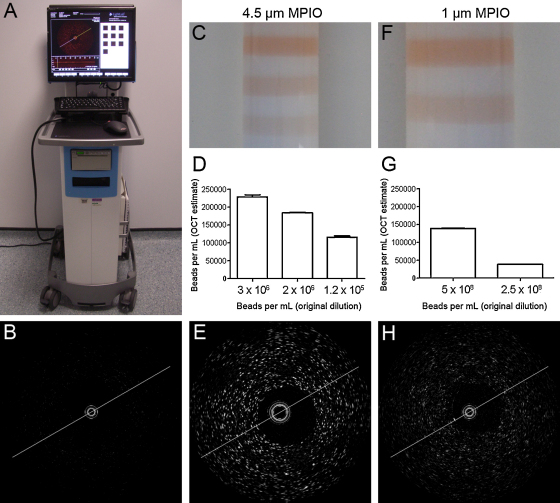
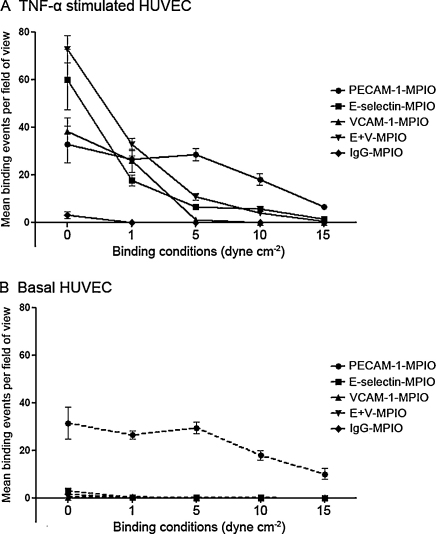
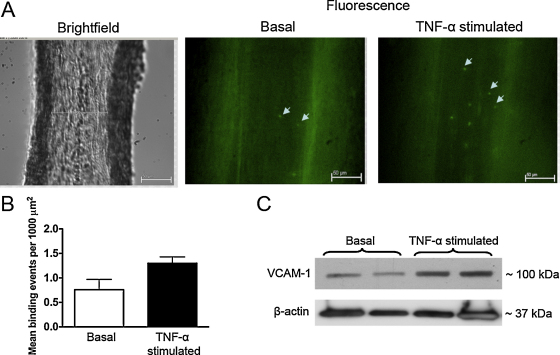
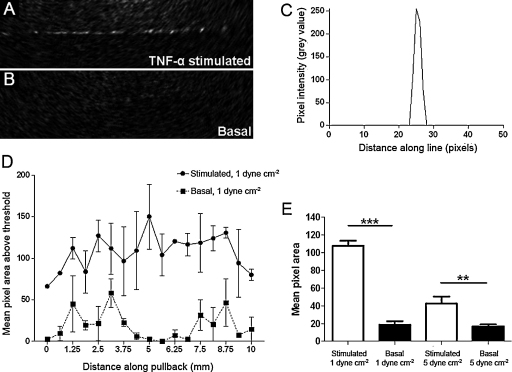
Methods and results: Microparticles of iron oxide (MPIO; 1 and 4.5 μm diameter) in suspension were visualized and accurately quantified using a clinical optical coherence tomography system. Bound to PECAM-1 on a plane of cultured endothelial cells under static conditions, 1 μm MPIO were also readily detected by OCT. To design a molecular contrast probe that would bind activated endothelium under conditions of shear stress, we quantified the expression (basal vs. TNF-activated; molecules μm(-2)) of VCAM-1 (not detected vs. 16 ± 1); PECAM-1 (132 ± 6 vs. 198 ± 10) and E-selectin (not detected vs. 46 ± 0.6) using quantitative flow cytometry. We then compared the retention of antibody-conjugated MPIO targeting each of these molecules plus a combined VCAM-1 and E-selectin (E+V) probe across a range of physiologically relevant shear stresses. E+V MPIO were consistently retained with highest efficiency (P < 0.001) and at a density that provided conspicuous contrast effects on OCT pullback.
Conclusion: Microparticles of iron oxide were detectable using a clinical OCT system. Assessment of binding under flow conditions recommended an approach that targeted both E-selectin and VCAM-1. Bound to HUVEC under conditions of flow, targeted 1 μm E+V MPIO were readily identified on OCT pullback. Molecular imaging with OCT may be feasible in vivo using antibody targeted MPIO.
Copyright © 2011 Elsevier Ireland Ltd. All rights reserved.
Figures

Similar articles
-
Magnetic resonance imaging of endothelial adhesion molecules in mouse atherosclerosis using dual-targeted microparticles of iron oxide.Arterioscler Thromb Vasc Biol. 2008 Jan;28(1):77-83. doi: 10.1161/ATVBAHA.107.145466. Epub 2007 Oct 25. Arterioscler Thromb Vasc Biol. 2008. PMID: 17962629 Free PMC article.
-
A leukocyte-mimetic magnetic resonance imaging contrast agent homes rapidly to activated endothelium and tracks with atherosclerotic lesion macrophage content.Arterioscler Thromb Vasc Biol. 2012 Jun;32(6):1427-35. doi: 10.1161/ATVBAHA.111.241844. Epub 2012 Apr 12. Arterioscler Thromb Vasc Biol. 2012. PMID: 22499989 Free PMC article.
-
Imaging vulnerable plaques by targeting inflammation in atherosclerosis using fluorescent-labeled dual-ligand microparticles of iron oxide and magnetic resonance imaging.J Vasc Surg. 2018 May;67(5):1571-1583.e3. doi: 10.1016/j.jvs.2017.04.046. Epub 2017 Jun 22. J Vasc Surg. 2018. PMID: 28648478
-
Anti-vascular cell adhesion molecule antibody M/K-2.7 and anti-P-selectin antibody RB40.34 conjugated microparticles of iron oxide.2008 Mar 8 [updated 2008 Apr 21]. In: Molecular Imaging and Contrast Agent Database (MICAD) [Internet]. Bethesda (MD): National Center for Biotechnology Information (US); 2004–2013. 2008 Mar 8 [updated 2008 Apr 21]. In: Molecular Imaging and Contrast Agent Database (MICAD) [Internet]. Bethesda (MD): National Center for Biotechnology Information (US); 2004–2013. PMID: 20641464 Free Books & Documents. Review.
-
Anti-vascular cell adhesion molecule antibody M/K-2.7–conjugated microparticles of iron oxide.2011 Jan 28 [updated 2011 Apr 14]. In: Molecular Imaging and Contrast Agent Database (MICAD) [Internet]. Bethesda (MD): National Center for Biotechnology Information (US); 2004–2013. 2011 Jan 28 [updated 2011 Apr 14]. In: Molecular Imaging and Contrast Agent Database (MICAD) [Internet]. Bethesda (MD): National Center for Biotechnology Information (US); 2004–2013. PMID: 21510041 Free Books & Documents. Review.
Cited by
-
Detection and minimally invasive treatment of early squamous lung cancer.Ther Adv Med Oncol. 2013 Jul;5(4):235-48. doi: 10.1177/1758834013482345. Ther Adv Med Oncol. 2013. PMID: 23858332 Free PMC article.
-
Molecular imaging of inflammation in atherosclerosis.Theranostics. 2013 Nov 1;3(11):865-84. doi: 10.7150/thno.5771. Theranostics. 2013. PMID: 24312156 Free PMC article. Review.
-
Label-Free, Longitudinal Visualization of PDT Response In Vitro with Optical Coherence Tomography.Isr J Chem. 2012 Sep;52(8-9):728-744. doi: 10.1002/ijch.201200009. Epub 2012 Sep 13. Isr J Chem. 2012. PMID: 23316088 Free PMC article.
-
Epigenetic basis of diabetic vasculopathy.Front Endocrinol (Lausanne). 2022 Dec 9;13:989844. doi: 10.3389/fendo.2022.989844. eCollection 2022. Front Endocrinol (Lausanne). 2022. PMID: 36568089 Free PMC article. Review.
-
Molecular magnetic resonance imaging of brain-immune interactions.Front Cell Neurosci. 2014 Nov 27;8:389. doi: 10.3389/fncel.2014.00389. eCollection 2014. Front Cell Neurosci. 2014. PMID: 25505871 Free PMC article. Review.
References
-
- Yabushita H., Bouma B.E., Houser S.L. Characterization of human atherosclerosis by optical coherence tomography. Circulation. 2002;106:1640–1645. - PubMed
-
- Tearney G.J., Yabushita H., Houser S.L. Quantification of macrophage content in atherosclerotic plaques by optical coherence tomography. Circulation. 2003;107:113–119. - PubMed
-
- Villanueva F.S., Jankowski R.J., Klibanov S. Microbubbles targeted to intercellular adhesion molecule-1 bind to activated coronary artery endothelial cells. Circulation. 1998;98:1–5. - PubMed
-
- Kabalka G., Buonocore E., Hubner K. Gadolinium-labeled liposomes: targeted MR contrast agents for the liver and spleen. Radiology. 1987;163:255–258. - PubMed
Publication types
MeSH terms
Substances
Grants and funding
LinkOut - more resources
Full Text Sources
Other Literature Sources
Miscellaneous
