. 2011 Dec 8;311(2):219-29.
doi: 10.1016/j.canlet.2011.07.023. Epub 2011 Aug 6.

Augmented therapeutic efficacy of irinotecan is associated with enhanced drug accumulation

Affiliations

Augmented therapeutic efficacy of irinotecan is associated with enhanced drug accumulation

Rami G Azrak et al. Cancer Lett. .

Abstract

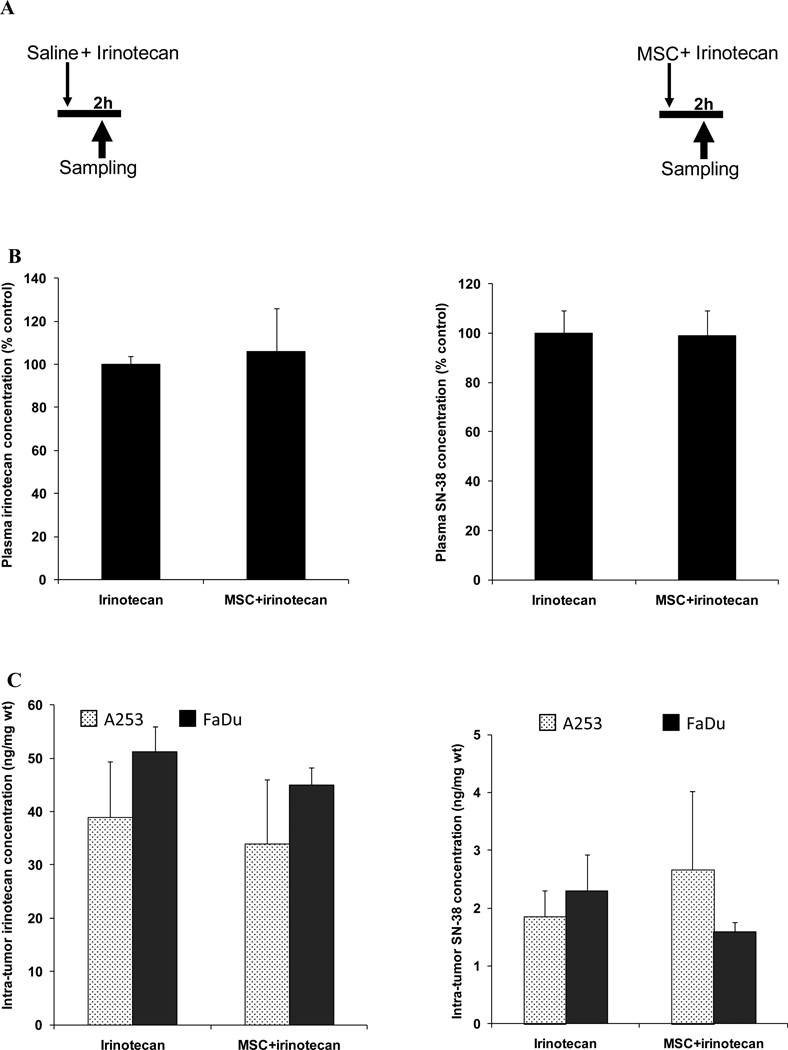
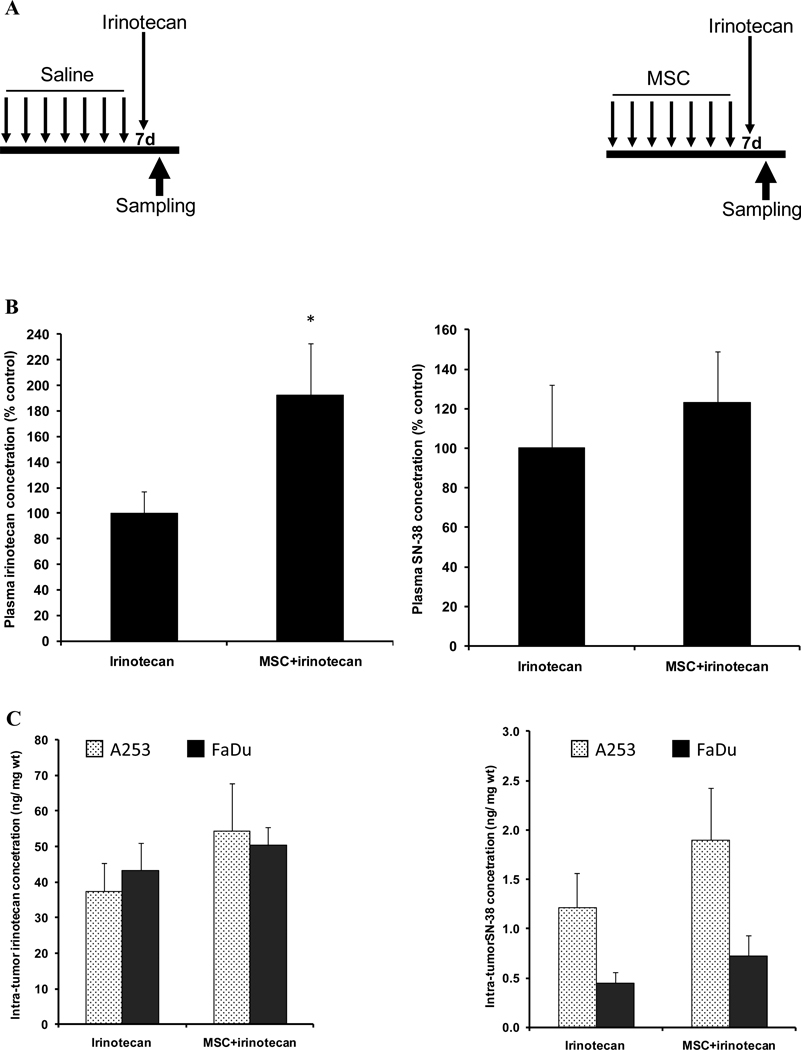
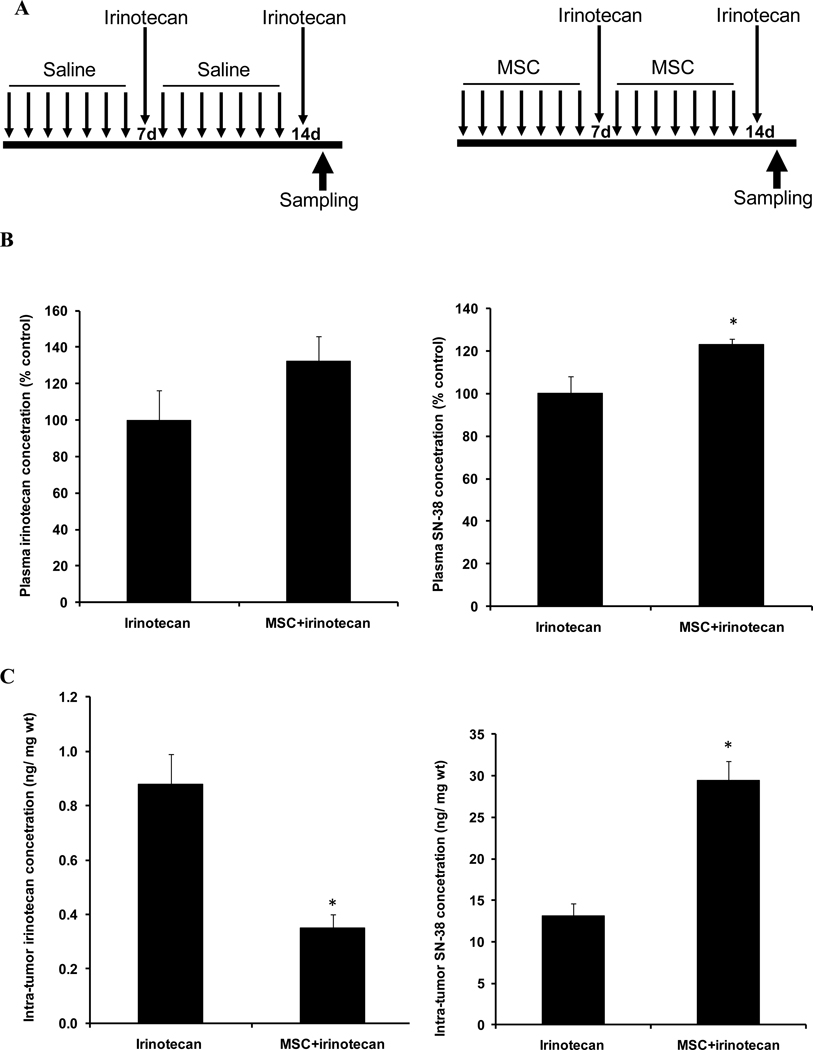
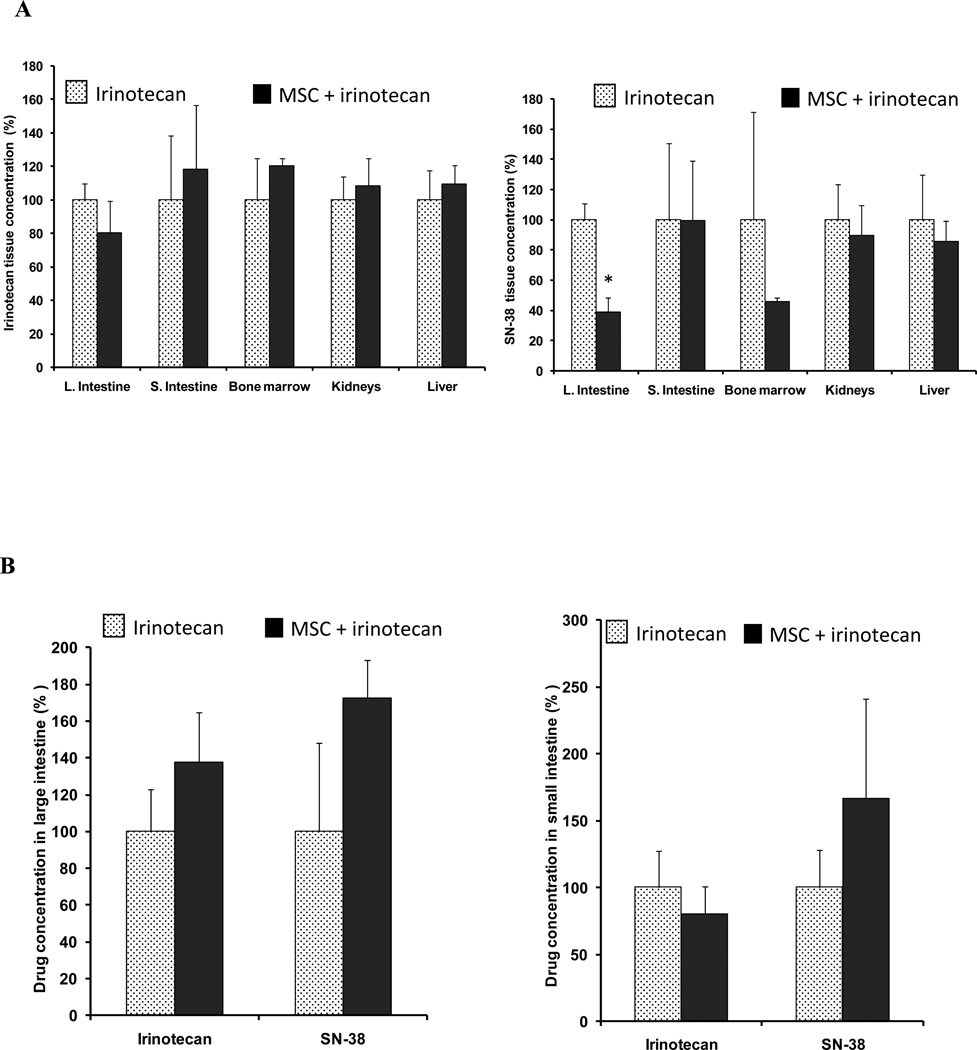
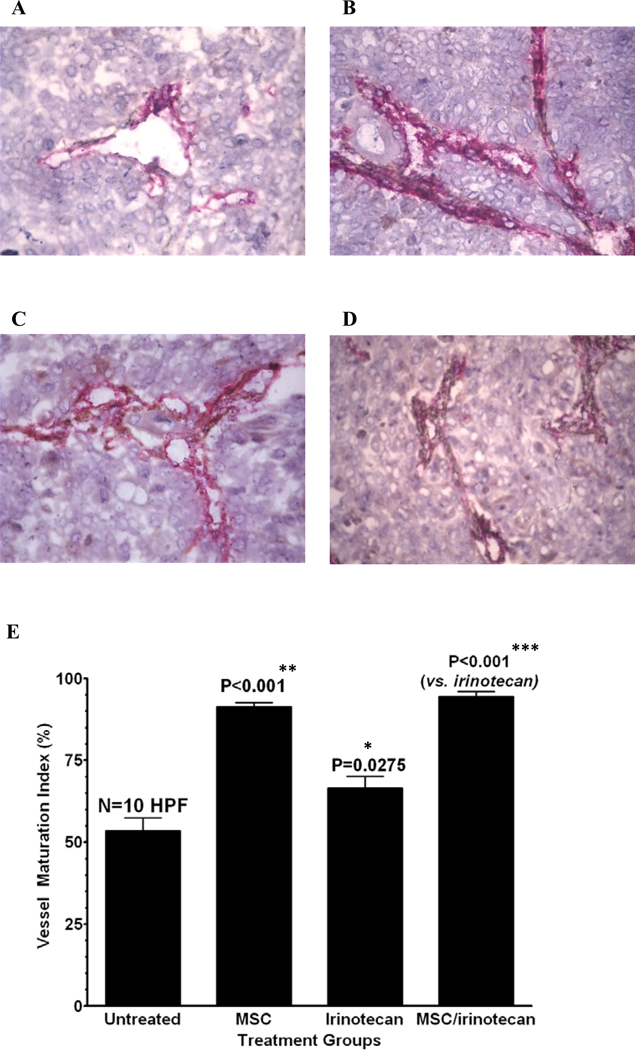
The goal of this study is to determine whether treatment with methylselenocysteine (MSC) results in differential uptake of irinotecan and its active metabolite (SN-38) between tumors of head and neck squamous cell carcinomas and normal tissue. The in vivo synergy between MSC and irinotecan is influenced by treatment schedule and associated with enhancement of tumor vessel maturation, intra-tumor concentration of SN-38 and apoptotic death of tumor cells. Normal tissue drug concentrations were not impacted by selenium treatment. The finding is of clinical relevance for enabling the delivery of higher doses of irinotecan to reverse tumor resistance, recurrence and ultimately enhancing cure rates.


Conflict of interest statement

Conflict of Interest

None of the authors has any financial or personal conflict of interest.

Figures

Figure 1
Figure 1. Drug concentrations after the concurrent treatment schedule
Panel A is the treatment schedule with irinotecan alone or in concurrent with MSC. Panel B is plasma irinotecan or SN-38 concentrations 2h after treatment with 100mg/kg irinotecan alone or after the concurrent combination treatment with MSC (0.2 mg/d) and irinotecan. Panel C is the irinotecan or SN-38 concentration in A253 or FaDu 2h after treatment with 100mg/kg irinotecan alone or in concurrent combination with MSC (0.2 mg/d). The figure shows no significant difference in drug concentration after the concurrent combination treatment when compared with irinotecan alone.
Figure 2
Figure 2. Drug concentrations after the first course treatment
Panel A is the sequential schedule when samples were analyzed 2h after the first course of treatment (7d) with irinotecan alone or in combination. Panel B shows plasma irinotecan or SN-38 concentration 2h after treatment with 100mg/kg irinotecan alone or after the first course sequential combination treatment with MSC (0.2 mg/d) and irinotecan. Panel C shows irinotecan or SN-38 concentrations in A253 or FaDu 2h after treatment with 100mg/kg irinotecan alone or first course sequential combination treatment with MSC (0.2 mg/d) and irinotecan. When compared with irinotecan alone, the data show a trend of increase of intra-tumor SN-38 concentration (panel C) but it was not significant when compared with irinotecan alone. The only significant change in drug concentrations was an increase in plasma irinotecan concentration in panel B (p<0.05). * denotes p < 0.05 when compared to irinotecan alone.
Figure 3
Figure 3. Drug concentrations after the second course treatment
Panel A is the sequential schedule when samples were analyzed 2h after the second course of treatment (14d) with irinotecan alone or in combination. Panel B shows plasma irinotecan or SN-38 concentration 2h after treatment with 100mg/kg irinotecan alone or after the second course sequential combination treatment with MSC (0.2 mg/d) and irinotecan. Panel C is irinotecan concentration or SN-38 concentration in FaDu tumor 2h after treatment with second course of irinotecan alone or in combination with MSC. After the combination treatment, significant increase (p<0.05) in SN-38 concentrations was observed when compared with irinotecan alone (panel B and C). In addition, irinotecan concentration in FaDu tumors was significantly decreased (p<0.05) after the combination treatment when compared with irinotecan alone (panel C). * denotes p < 0.05 when compared to irinotecan alone.
Figure 4
Figure 4. Drug concentrations in normal tissue
Panel A shows irinotecan or SN-38 concentrations in large intestine, small intestine, bone marrow, kidneys and liver 2h after treatment with 100mg/kg irinotecan alone , or concurrent combination treatment of MSC (0.2 mg/d) and irinotecan . Panel B shows irinotecan and SN-38 concentrations in large intestine or small intestine 2h after the second course of 100mg/kg irinotecan alone , or in combination with MSC . When compared with irinotecan alone, the only significant change in drug concentration was a decrease in large intestine SN-38 concentration in panel A (p<0.05). * denotes p < 0.05 when compared to irinotecan alone.
Figure 5
Figure 5
Induction of intra-tumor microvessel maturation after the second course of the sequential combination treatment MSC enhances intra-tumor microvessel maturation as studied on CD31/α-SMA double stained (CD31 for endothelial cells: red, α-SMA for pericytes: brown) frozen sections of FaDu xenografts on day 15 after various treatments (Panel A: untreated, B: MSC, C: irinotecan, D: irinotecan/MSC). The bar graphs show the corresponding vascular maturation index (VMI) which is generally used as a quantitative measure for vascular maturation. The photomicrographs visualize the trend of the change in the pattern of double-immunostaining of the vessels, illustrating that the brown component for pericytes is increasing if MSC treatment is involved (panel B versus A and panel D versus C). The date of relevant bar graphs from computer image analysis numerically demonstrates that MSC alone and in combination significantly enhanced the VMI as compared to the control or CPT induced VMI, respectively. It proves that MSC treatment increases the proportion of pericytes associated with endothelial cells which is an indication of vessel maturation. CPT treatment alone also increased VMI, but less effective than MSC alone, as compared to the control. * denotes p < 0.05 when compared to untreated controls, ** denotes p < 0.001 when compared to irinotecan alone and *** denotes p < 0.001 when compared to untreated controls.
Figure 6
Figure 6. Induction of apoptotic cell death after the second course of the sequential combination treatment
The pictures are representative microphotographs of conventional, formalin-paraffin sections of the tumors after hematoxylin-eosin staining. Apoptotic cells were identified by morphology based on the characteristic nuclear fragmentation and condensation. Apoptotic tumor cell nuclei were counted among 300–400 tumor cell nuclei on H.E. slides in randomly selected, non-necrotic fields (×400) of tumor and expressed as a percentage. Panel A1 illustrates that MSC did not change the incidence of apoptotic tumor cells, as compared to the control (panel A2). Panel B1 visualizes that the first CPT treatment on day 7 induced several apoptotic tumor cells indicated by arrows, but the combination treatment with MSC (panel B2) did not increase the apoptotic incidence significantly. Panel C1 demonstrates that the second irinotecan treatment on day 14 also induces apoptotic tumor cells labeled by arrows and the combination treatment with MSC (panel C2) significantly increased the apoptosis incidence, as seen on the corresponding bar graphs. The presence of apoptotic cells were confirmed by Tunel immunohistochemical assay. Representative microphotographs of Tunel immunostaining for apoptotic cells (brown) with nuclear counterstaining with haematoxylin (blue). The figure confirms the presence of apoptotic cells in formalin/paraffin sections in FaDu xenografts taken 14 days after the last treatment. Original magnification is ×400 for all panels. Panel D1 shows buffer control for staining specificity (negative control); in panel D2 shows an untreated FaDu xenograft with sporadic apoptotic tumor cells; in panel D3, MSC did not increase the number of apoptotic cells when compared to untreated controls; in panel D4, irinotecan-treated xenograft increased apoptotic tumor cell induction; and in panel D5, the second course of combination treatment resulted in significant increase of apoptotic cell tumor cells (p<0.05) when compared with irinotecan alone. The corresponding bar graphs show the quantitation of the apoptotic tumor cell fraction (%). * denotes p < 0.05 when compared to irinotecan alone.

References

    1. Rivory LP, Bowles MR, Robert J, Pond SM. Conversion of irinotecan (CPT-11) to its active metabolite, 7-ethyl-10-hydroxycamptothecin (SN-38), by human liver carboxylesterase. Biochemical Pharmacology. 1996;52:1103–1111. - PubMed
    1. Ma MK, McLeod HL. Lessons learned from the irinotecan metabolic pathway. Current Medicinal Chemistry. 2003;10:41–49. - PubMed
    1. Rivory LP. Irinotecan (CPT-11): a brief overview. Clinical & Experimental Pharmacology & Physiology. 1996;23:1000–1004. - PubMed
    1. Ip C. Lessons from basic research in selenium and cancer prevention. Journal of Nutrition. 1998;128:1845–1854. - PubMed
    1. Cao S, Durrani F, Rustum YM. Selective modulation of the therapeutic efficacy of anticancer drugs by selenium containing compounds against human tumor xenografts. Clinical Cancer Resreach. 2004;10:2561–2569. - PubMed

Publication types

MeSH terms