. 2011 Oct;179(4):2028-41.
doi: 10.1016/j.ajpath.2011.06.006. Epub 2011 Aug 26.

Stimulation of adult oligodendrogenesis by myelin-specific T cells

Affiliations

Stimulation of adult oligodendrogenesis by myelin-specific T cells

Helle Hvilsted Nielsen et al. Am J Pathol. 2011 Oct.

Abstract

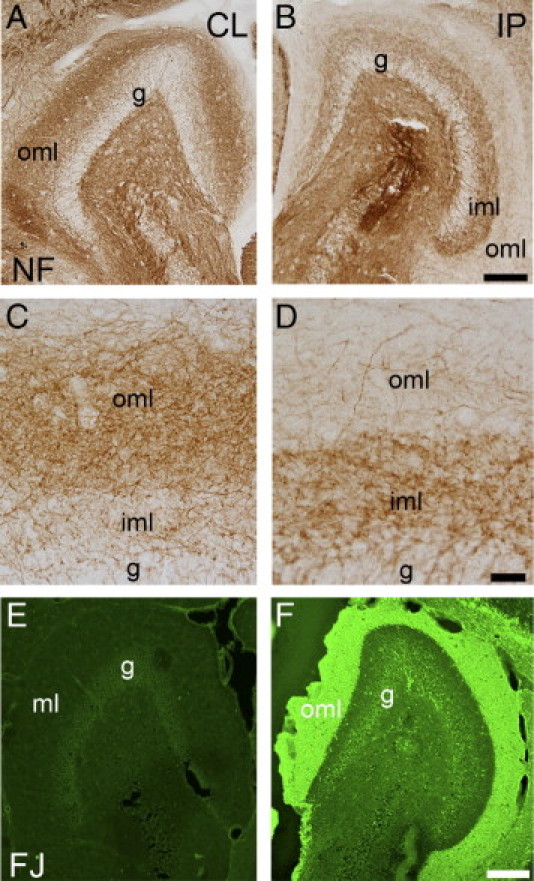
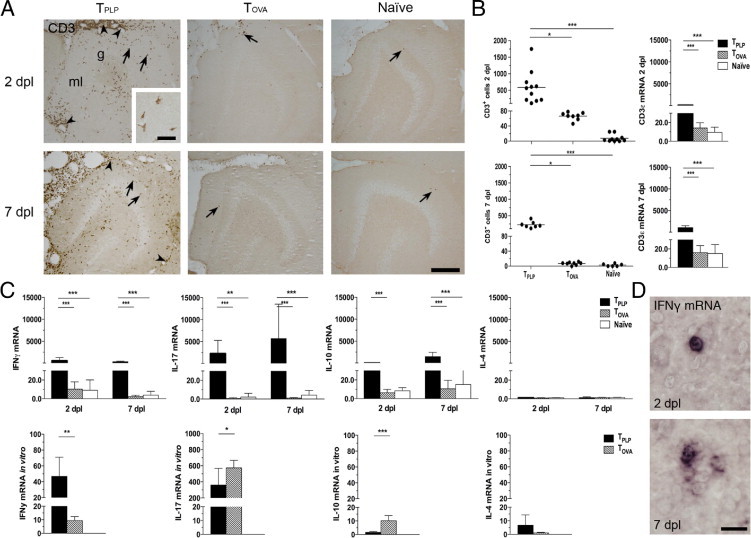
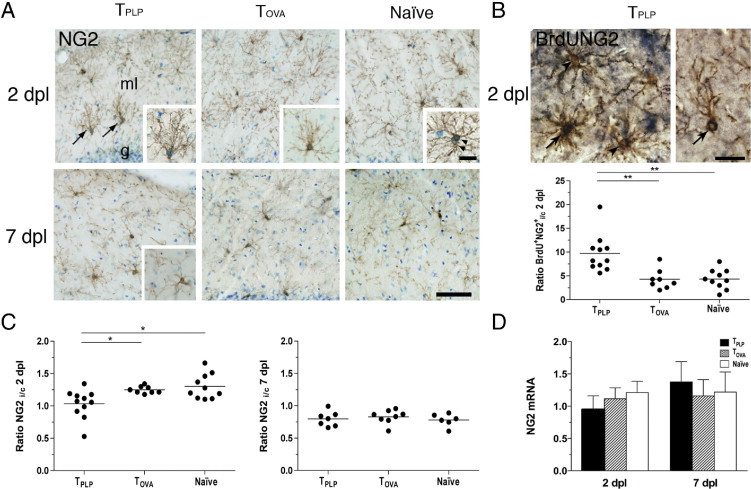
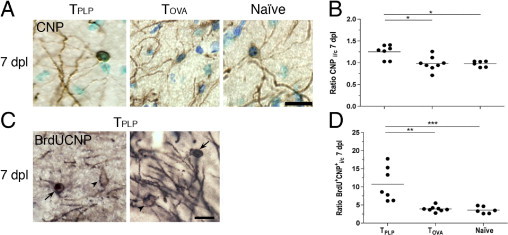
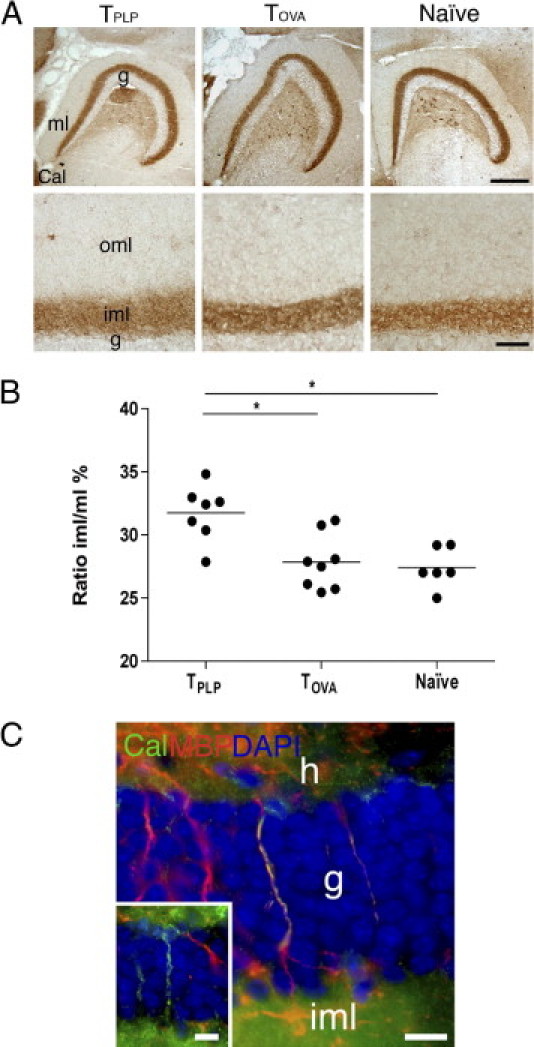
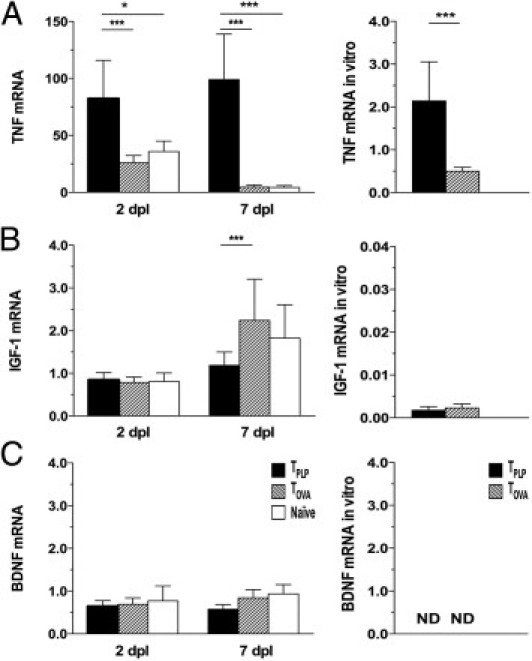
In multiple sclerosis (MS), myelin-specific T cells are normally associated with destruction of myelin and axonal damage. However, in acute MS plaque, remyelination occurs concurrent with T-cell infiltration, which raises the question of whether T cells might stimulate myelin repair. We investigated the effect of myelin-specific T cells on oligodendrocyte formation at sites of axonal damage in the mouse hippocampal dentate gyrus. Infiltrating T cells specific for myelin proteolipid protein stimulated proliferation of chondroitin sulfate NG2-expressing oligodendrocyte precursor cells early after induction via axonal transection, resulting in a 25% increase in the numbers of oligodendrocytes. In contrast, T cells specific for ovalbumin did not stimulate the formation of new oligodendrocytes. In addition, infiltration of myelin-specific T cells enhanced the sprouting response of calretinergic associational/commissural fibers within the dentate gyrus. These results have implications for the perception of MS pathogenesis because they show that infiltrating myelin-specific T cells can stimulate oligodendrogenesis in the adult central nervous system.


Figures

Figure 1
Figure 1
Afferent fibers with potential for sprouting persist after PP lesioning. A–D: Staining for NF at 7 days post lesion demonstrates the NF+ fibers in intact contralateral dentate gyrus (A and C) and the reduced amount of NF+ fibers in the outer molecular layer (oml) of the deafferented ipsilateral (IP) dentate gyrus (B and D). The NF+ fibers that persist in the outer molecular layer may represent calretinergic and cholinergic afferent fibers and other afferent fibers not part of the PP. E and F: Fluoro-Jade staining of the dentate gyrus at 7 days post lesion. The anterograde axonal and terminal degeneration is visualized as an intense band of green fluorescence in the deafferented outer molecular layer in the ipsilateral dentate gyrus (E). No degeneration is observed in the contralateral dentate gyrus (F). CL, contralateral layer; g, granule cell layer; iml, inner molecular layer; ml, molecular layer. Scale bars: 20 μm (C and D); 150 μm (A, B, E, and F).
Figure 2
Figure 2
T cells infiltrate zones of axonal degeneration in lesioned TPLP mice. A: Increased infiltration of CD3+ T cells (arrows) in the molecular layer (ml) of PP-lesioned TPLP animals compared with scarce T cells in TOVA and naïve mice at 2 and 7 days post lesion. Note the meningeal infiltration, which is most pronounced in lesioned TPLP animals (arrowheads). g, granule cell layer. Scale bars: 10 μm; 250 μm (inset). B: Cell counting data demonstrate an enhanced number of CD3+ T cells in the molecular layer, and qPCR demonstrated enhanced expression of CD3ε mRNA in hippocampi of TPLP mice compared with TOVA and naïve mice at 2 and 7 days post lesion. Lines represent the mean. *P < 0.05; ***P < 0.001. C: qPCR detection demonstrates enhanced mRNA expression of IFN-γ, IL-17, and IL-10 but not IL-4 in hippocampi of TPLP mice compared with TOVA and naïve mice at 2 and 7 days post lesion (top row) and in TPLP mice compared with TOVA mice in vitro (bottom row). TOVA mice exhibited only a modest increase in IFN-γ in vivo and in vitro. Results are given as mean ± SD. *P < 0.05; **P < 0.01; ***P < 0.001. D:In situ hybridization demonstrates scarce IFN-γ mRNA–expressing cells in the hippocampus proper at 2 and 7 days post lesion. Scale bar = 20 μm.
Figure 3
Figure 3
Myelin-reactive T cells stimulate OPC proliferation and differentiation in response to lesioning. A: NG2 staining demonstrates activated NG2+ OPC at 2 days post lesion. Hypertrophic cells (inset in TOVA) and cellular double profiles (inset in Naïve) are observed in all groups of PP-lesioned mice. In TPLP mice, NG2+ cells additionally extended their processes into the area of T cell infiltration (arrows and inset). At 7 days post lesion, the NG2+ cells exhibited a similar structure in all groups, but were difficult to distinguish. Sections were counterstained with toluidine blue for visualization of cellular nuclei. g, granule cell layer; ml, molecular layer. Scale bars: 25 μm; 10 μm (inset). B: BrdU incorporation into mitotic NG2+ cell (left arrow) together with nonmitotic NG2+ cells (left arrowheads) at 2 days post lesion. BrdU incorporation was also observed in NG2+ cells extending their processes into the outer molecular layer (right arrow). Scale bar = 10 μm. Ipsilateral and contralateral ratios of BrdU+NG2+ cells at 2 days post lesion demonstrate a significantly elevated proliferation in TPLP mice compared with TOVA and naïve mice. Lines mark the mean. **P < 0.01. C: NG2+ cells given as ipsilateral and contralateral ratios in the molecular layer in TPLP mice at 2 days post lesion failed to show lesion-induced proliferation. At 7 days post lesion, there was no longer any difference between the groups. D: qPCR analysis of the hippocampus demonstrated a trend toward decreased mRNA expression of NG2 in TPLP mice at 2 days post lesion, whereas no difference was observed at 7 days post lesion. Results are given as mean ± SD.
Figure 4
Figure 4
Enhanced oligodendrogenesis in TPLP mice at 7 days post lesion. A: CNP-stained sections demonstrated no differences in oligodendrocyte structure (inset) in TPLP, TOVA, and naïve mice at 7 days post lesion, but increased clearance of myelin debris in TPLP mice. Sections were counterstained using toluidine blue. Scale bar = 10 μm. B: Ipsilateral and contralateral ratios of CNP+ cells in the outer molecular layer at 7 days post lesion demonstrate an increased ratio in TPLP mice. Lines mark the mean. *P < 0.05. C: Postproliferative BrdU+CNP+ oligodendrocyte (left arrow) in TPLP mouse at 7 days post lesion, together with a non-dividing CNP+ oligodendrocyte (left arrowhead). BrdU+CNP+ cells with processes extending toward myelinated fibers (right arrow) together with single-labeled cells (right arrowhead). Scale bar = 10 μm. D: Ipsilateral and contralateral ratios of BrdU+CNP+ cells at 7 days post lesion demonstrate increased ratios in TPLP mice compared with TOVA and naïve mice. Lines mark the mean. **P < 0.01; ***P < 0.001.
Figure 5
Figure 5
Enhanced lesion-induced sprouting of calretinergic fibers in TPLP-infiltrated dentate gyrus. A: Calretinin staining of hilar mossy cells and their terminals at 7 days post lesion. Note in the TOVA and naïve mice the well-defined border between the inner (iml) and outer (oml) molecular layers. In TPLP mice, this border is fuzzy, reflecting calretinergic fibers sprouting from the inner molecular layer and translaminarly into the outer molecular layer. g, granule cell layer; ml, molecular layer. Scale bars: 200 μm; 20 μm (inset). B: Area estimation demonstrates an increased inner molecular layer–molecular layer ratio in TPLP mice compared with TOVA and naïve mice at 7 days post lesion. Lines mark the mean. *P < 0.05. C: Double immunofluorescence labeling for calretinin (green) and MBP (red) demonstrates co-localization of MBP to a calretinin+ fiber (yellow) transversing the granule cell layer (g; blue). Unmyelinated calretinin+ fibers are also observed (inset). h, Hilus. Scale bars = 10 μm.
Figure 6
Figure 6
Enhanced expression of TNF but not IGF-1 or BDNF in TPLP mice. A: TNF mRNA expression was continuously elevated in TPLP mice from 2 days post lesion through 7 days post lesion, compared with TOVA and naïve mice, and in vitro TPLP cultures compared with TOVA cultures. B: IGF-1 mRNA expression demonstrated no changes at 2 days post lesion in TPLP, TOVA, and naïve mice. In contrast, IGF-1 mRNA expression was elevated in TOVA and naïve animals at 7 days post lesion but not in PP-lesioned TPLP mice. IGF-1 mRNA expression was low in TPLP and TOVA mice in vitro. C: BDNF mRNA expression showed no changes at 2 and 7 days post lesion in TPLP, TOVA, and naïve mice. BDNF mRNA expression was not detected in vitro. *P < 0.05; **P < 0.01; ***P < 0.001. ND, not detected.

Similar articles

Cited by

References

    1. Weiner H.L. Multiple sclerosis is an inflammatory T-cell–mediated autoimmune disease. Arch Neurol. 2004;61:1613–1615. - PubMed
    1. Lucchinetti C., Brück W., Parisi J., Scheithauer B., Rodriguez M., Lassmann H. Heterogeneity of multiple sclerosis lesions: implications for the pathogenesis of demyelination. Ann Neurol. 2000;47:707–717. - PubMed
    1. Wolswijk G. Oligodendrocyte precursor cells in the demyelinated multiple sclerosis spinal cord. Brain. 2002;125:338–349. - PubMed
    1. Raine C.S., Wu E. Multiple sclerosis: remyelination in acute lesions. J Neuropathol Exp Neurol. 1993;52:199–204. - PubMed
    1. Dawson M.R., Polito A., Levine J.M., Reynolds R. NG2-expressing glial progenitor cells: an abundant and widespread population of cycling cells in the adult rat CNS. Mol Cell Neurosci. 2003;24:476–488. - PubMed

Publication types

MeSH terms