

Tween sex differences in snacking preferences during television viewing
- PMID: 21872703
- PMCID: PMC3164544
- DOI: 10.1016/j.jada.2011.06.004
Tween sex differences in snacking preferences during television viewing
Abstract
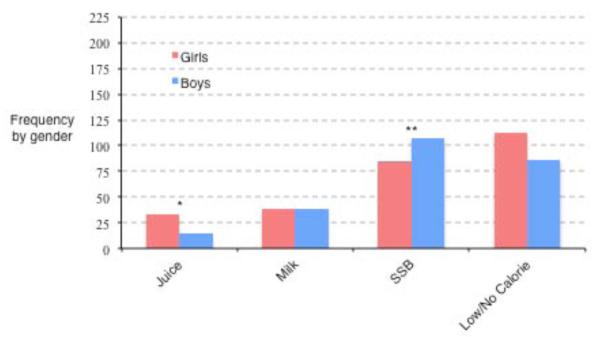
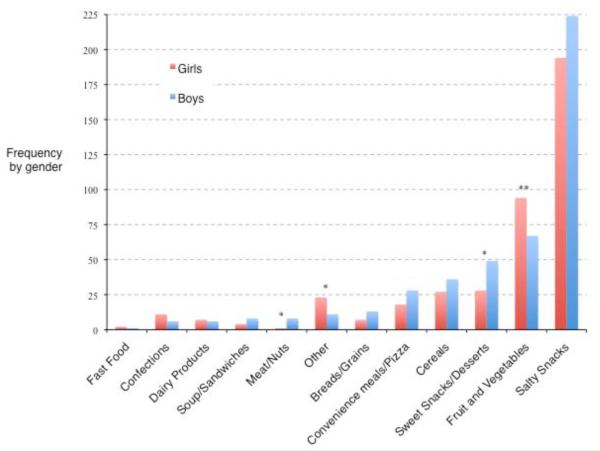
Television viewing is associated with an increased risk in childhood obesity. Research surrounding food habits of tweens largely bypasses snacking preferences while watching television in the home. The aim of this cross-sectional study was to describe snacking prevalence by tween sex and to describe parental rules surrounding snacking while watching television at home. Survey data were obtained in 2008 from 4th- through 6th-grade students (n=1,557) who attended 12 New England schools. Complete self-reported measures (n=1,448) included demographics, household and bedroom television ownership, television watching frequency, snacking prevalence, snacking preferences, and parental rules regarding snacking while watching television. Comparisons were generated using χ(2) analyses. Overall, the majority of children (69.2%) snacked "sometimes" or "always" during television viewing, with the majority of responses (62.9%) categorized as foods. The most popular food snacks for both sexes in this sample were salty snacks (47.9%), with fruits and vegetables ranking a distant second (18.4%). Girls (22.6%) selected fruits and vegetables more frequently than boys (14.7%) (P=0.003). Of those drinking beverages (n=514), boys selected sugar-sweetened beverages more often than girls (43.5% vs 31.7%; P=0.006), and girls chose juice more often than boys (12.3% vs 6.1%; P=0.02). Overall, approximately half (53.2%) of the students consumed less-healthy snacks while watching television. Interventions for parents and both sexes of tweens focusing on healthy snacking choices may have long-term beneficial outcomes.
Copyright © 2011 American Dietetic Association. Published by Elsevier Inc. All rights reserved.
Figures
Similar articles
-
Parental weight status and girls' television viewing, snacking, and body mass indexes.Obes Res. 2003 Jan;11(1):143-51. doi: 10.1038/oby.2003.23. Obes Res. 2003. PMID: 12529497 Free PMC article.
-
Influences of Parental Snacking-Related Attitudes, Behaviours and Nutritional Knowledge on Young Children's Healthy and Unhealthy Snacking: The ToyBox Study.Nutrients. 2020 Feb 7;12(2):432. doi: 10.3390/nu12020432. Nutrients. 2020. PMID: 32046193 Free PMC article.
-
Snacking Patterns of Preschool-Aged Children: Opportunity for Improvement.Can J Diet Pract Res. 2018 Mar 1;79(1):2-6. doi: 10.3148/cjdpr-2017-022. Epub 2017 Aug 11. Can J Diet Pract Res. 2018. PMID: 28799788
-
Conditioned to eat while watching television? Low-income caregivers' perspectives on the role of snacking and television viewing among pre-schoolers.Public Health Nutr. 2016 Jun;19(9):1598-605. doi: 10.1017/S136898001500364X. Epub 2016 Jan 22. Public Health Nutr. 2016. PMID: 26794059 Free PMC article.
-
Television viewing and snacking behaviors of fourth- and eighth-grade schoolchildren in Texas.Prev Chronic Dis. 2009 Jul;6(3):A89. Epub 2009 Jun 15. Prev Chronic Dis. 2009. PMID: 19527590 Free PMC article.
Cited by
-
Sweetened drink and snacking cues in adolescents: a study using ecological momentary assessment.Appetite. 2013 Aug;67:61-73. doi: 10.1016/j.appet.2013.03.016. Epub 2013 Apr 11. Appetite. 2013. PMID: 23583312 Free PMC article.
-
Trends in dietary intake in Switzerland, 1999 to 2009.Public Health Nutr. 2014 Mar;17(3):479-85. doi: 10.1017/S1368980013000207. Epub 2013 Feb 21. Public Health Nutr. 2014. PMID: 23425344 Free PMC article.
References
-
- Ogden CL, Carroll MD, Curtin LR, Lamb MM, Flegal KM. Prevalence of high body mass index in US children and adolescents, 2007-2008. JAMA. 2010 Jan 20;303(3):242–249. - PubMed
-
- Lorson BA, Melgar-Quinonez HR, Taylor CA. Correlates of fruit and vegetable intakes in US children. J Am Diet Assoc. 2009 Mar;109(3):474–478. - PubMed
-
- Nicklas TA, Elkasabany A, Srinivasan SR, Berenson G. Trends in nutrient intake of 10- year-old children over two decades (1973-1994) : the Bogalusa Heart Study. Am J Epidemiol. 2001 May 15;153(10):969–977. - PubMed
-
- U.S. Department of Agriculture, Agricultural Research Service, Beltsville Human Nutrition Research Center. Food Surveys Research Group Snacking Patterns of U.S. Adolescents: What we eat in America, NHANES 2005-2006. Food Series Research Group Data Brief. 2010 Available from: http://ars.usda.gov/Services/docs.htm?docid=19476.
Publication types
MeSH terms
Grants and funding
LinkOut - more resources
Full Text Sources
