

Economic and geographic drivers of wildlife consumption in rural Africa
- PMID: 21873180
- PMCID: PMC3161600
- DOI: 10.1073/pnas.1011526108
Economic and geographic drivers of wildlife consumption in rural Africa
Abstract
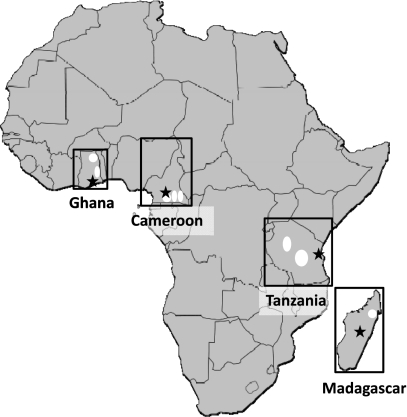
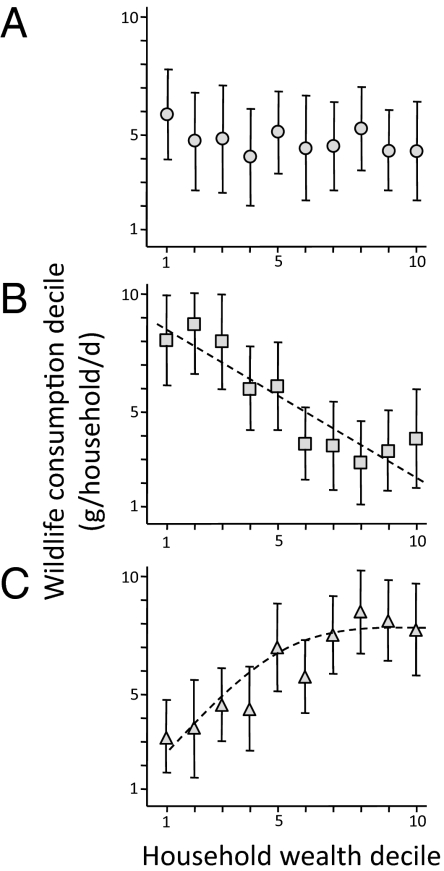
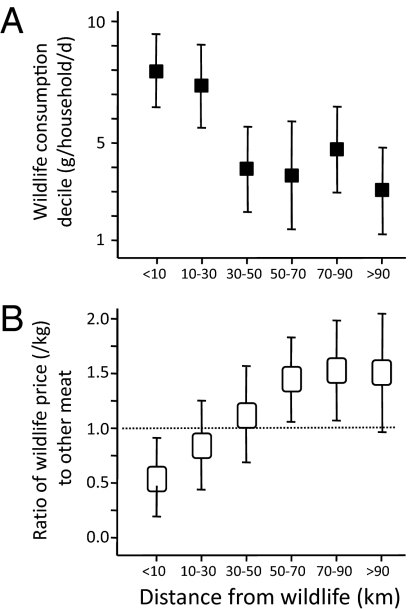
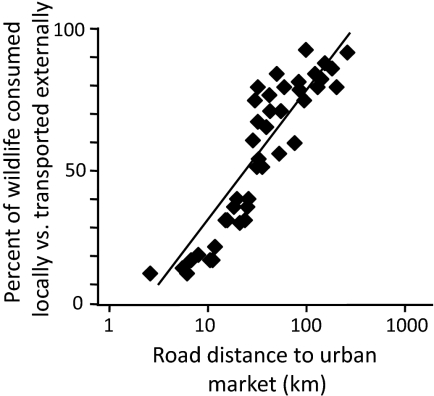
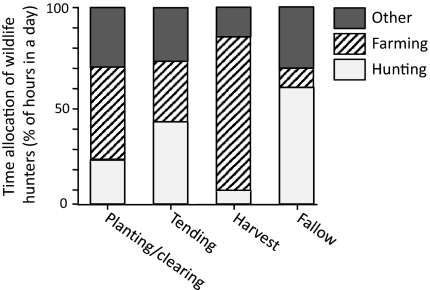
The harvest of wildlife for human consumption is valued at several billion dollars annually and provides an essential source of meat for hundreds of millions of rural people living in poverty. This harvest is also considered among the greatest threats to biodiversity throughout Africa, Asia, and Latin America. Economic development is often proposed as an essential first step to win-win solutions for poverty alleviation and biodiversity conservation by breaking rural reliance on wildlife. However, increases in wealth may accelerate consumption and extend the scale and efficiency of wildlife harvest. Our ability to assess the likelihood of these two contrasting outcomes and to design approaches that simultaneously consider poverty and biodiversity loss is impeded by a weak understanding of the direction and shape of their interaction. Here, we present results of economic and wildlife use surveys conducted in 2,000 households from 96 settlements in Ghana, Cameroon, Tanzania, and Madagascar. We examine the individual and interactive roles of wealth, relative food prices, market access, and opportunity costs of time spent hunting on household rates of wildlife consumption. Despite great differences in biogeographic, social, and economic aspects of our study sites, we found a consistent relationship between wealth and wildlife consumption. Wealthier households consume more bushmeat in settlements nearer urban areas, but the opposite pattern is observed in more isolated settlements. Wildlife hunting and consumption increase when alternative livelihoods collapse, but this safety net is an option only for those people living near harvestable wildlife.
Conflict of interest statement
The authors declare no conflict of interest.
Figures
References
-
- Milner-Gulland EJ, Bennett EL. Society for Conservation Biology 2002 Wild Meat Group Wild meat: The big picture. Trends Ecol Evol. 2003;18:351–357.
-
- Robinson JG, Bennett EL. Hunting for Sustainability in Tropical Forests. New York: Colombia University Press; 2000.
-
- Redford KH. The empty forest. BioScience. 1992;42:412–422.
-
- Robinson JR, Redford KH, Bennett EL. Wildlife harvest in logged tropical forest. Science. 1999;284:595–596.
-
- Brashares JS, et al. Bushmeat hunting, wildlife declines, and fish supply in West Africa. Science. 2004;306:1180–1183. - PubMed
Publication types
MeSH terms
LinkOut - more resources
Full Text Sources
Medical
Miscellaneous
