. 2011 Sep 6;108(36):14950-5.
doi: 10.1073/pnas.1112213108. Epub 2011 Aug 22.

Transcriptional programs in transient embryonic zones of the cerebral cortex defined by high-resolution mRNA sequencing

Affiliations

Transcriptional programs in transient embryonic zones of the cerebral cortex defined by high-resolution mRNA sequencing

Albert E Ayoub et al. Proc Natl Acad Sci U S A. .

Abstract

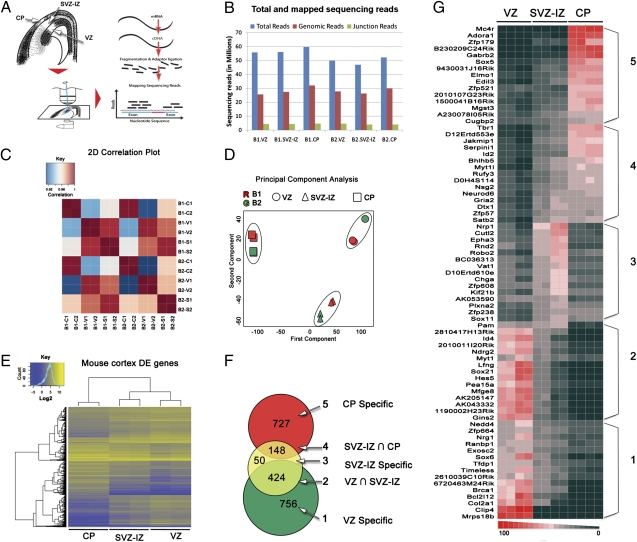
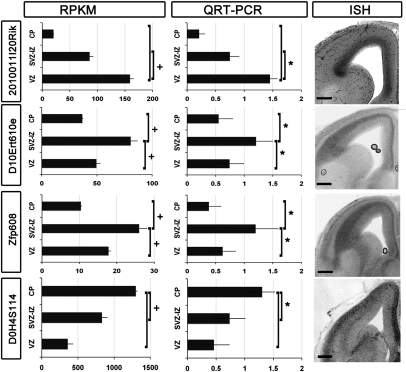
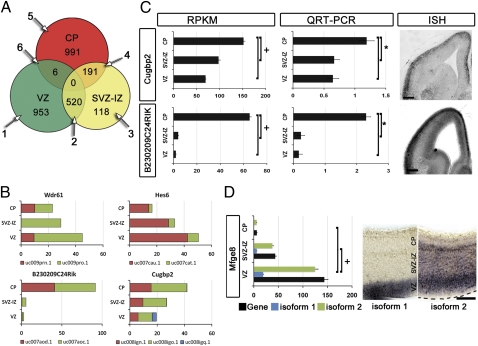
Characterizing the genetic programs that specify development and evolution of the cerebral cortex is a central challenge in neuroscience. Stem cells in the transient embryonic ventricular and subventricular zones generate neurons that migrate across the intermediate zone to the overlying cortical plate, where they differentiate and form the neocortex. It is clear that not one but a multitude of molecular pathways are necessary to progress through each cellular milestone, yet the underlying transcriptional programs remain unknown. Here, we apply differential transcriptome analysis on microscopically isolated cell populations, to define five transcriptional programs that represent each transient embryonic zone and the progression between these zones. The five transcriptional programs contain largely uncharacterized genes in addition to transcripts necessary for stem cell maintenance, neurogenesis, migration, and differentiation. Additionally, we found intergenic transcriptionally active regions that possibly encode unique zone-specific transcripts. Finally, we present a high-resolution transcriptome map of transient zones in the embryonic mouse forebrain.


Conflict of interest statement

The authors declare no conflict of interest.

Figures

Fig. 1.
Fig. 1.
Determination of zone-specific differential expression. (A) Schematic shows experimental steps: we used LMD to isolate each of the cellular zones (VZ, SVZ–IZ, and CP) from E14.5 brains in coronal sections chosen by systematic random sampling. We performed single-end 75-bp RNA sequencing on the Illumina Genome Analyzer IIx. (B) Graph shows reads uniquely mapped to the mouse genome and splice junctions compared with the total number of sequencing reads that passed quality checks. (C). Two-dimensional correlation plot of gene expression levels between sequencing lanes. Spearman R2 for each technical replicate and zone are color-coded from 0.92 (blue) to 1 (red). Labels starting with “B1” and “B2” indicate biological replicas 1 and 2 respectively; C, CP; S, SVZ-IZ; V, VZ. (D) Principal components analysis plot of log2-(RPKM) for 12 samples confirms that the correlation of technical replicates is higher than biological replicates, which in turn is much higher than different tissue samples. (E). Unsupervised hierarchical clustering of DEGs. RPKM values were log2-transformed and clustered using the gplots and heatmap.2 packages in R. The color scale (Top Left) indicates levels of expression, with yellow corresponding to high expression levels and blue corresponding to low. (F) Venn diagram shows zone-specific gene expression after pairwise comparisons. We applied a Benjamini–Hochberg P value (bhp < 10−5) and a twofold change in expression to determine DEGs. (G). Heat map shows the fractional change in expression for a subset of DEGs in each of the five groups in B. Each row represents the fraction of expression from all flow cells for a particular gene (red is highest; black is lowest).
Fig. 2.
Fig. 2.
Verification of zone-specific genes. A row of three panels is shown for every gene named on the left side. The first panel shows mean RPKM expression levels (±SEM). Significance is based on pairwise comparisons and bhp < 10−5 (+). The second column of graphs shows qRT-PCR on RNA isolated by LMD from E14.5 cryosections. Mean fold change (±SEM) is plotted for every cellular zone (*P < 0.001). The third column shows ISH on E14.5 mouse sections.
Fig. 3.
Fig. 3.
Network analysis of zone-specific SOM modules. Networks were generated by using the GeneMania large functional association database based on SOM module membership. Edges connecting different nodes (i.e., genes) represent data derived from other studies. (A). Representative cluster from VZ ∩ SVZ–IZ highlighting all edges emanating from Sox2 and Pax6 to other members of the SOM module. (B) Network from SVZ-IZ module highlighting all edges connecting the novel gene D10Ert610e to Nrp1 and Sema3c, which are involved in axonogenesis. (C). SOM-based network from CP-specific modules shows extensive connections between the novel gene B230209C24RIK and Cplx1 and Dync1i1, which are involved in exocytosis.
Fig. 4.
Fig. 4.
Distribution and verification of splice isoforms. (A). Venn diagram shows the distribution of splice isoforms in six groups after pairwise comparisons, log2 fold change, and bhp < 10−5. (B) The expression levels of different isoforms for the same gene are additive. However, isoforms for Wdr61 have opposing gradients, whereas Hes6, B230209C24Rik, and Cugbp2 isoforms have similar expression gradients across zones. (C) We verified the expression of B230209C24Rik and Cugbp2 by qRT-PCR after LMD. The first column shows mean RPKM expression levels (±SEM; +, bhp < 10−5). The second column of graphs shows mean fold change in qRT-PCR (±SEM) plotted for every cellular zone (*P < 0.001). ISH shows that tissue distribution is comparable to the expression gradient determined by the differential analysis. (D) Mfge8 has two DEIs in the neocortex at E14.5 with different expression gradients. The first column shows mean RPKM expression levels (±SEM; +, bhp <10−5). We also confirmed the difference in the distribution of isoforms by ISH in the mouse cortex. ISH was performed in parallel by using probes designed to differentiate between the two isoforms.

Similar articles

Cited by

References

    1. Rakic P, Ayoub AE, Breunig JJ, Dominguez MH. Decision by division: Making cortical maps. Trends Neurosci. 2009;32:291–301. - PMC - PubMed
    1. Bystron I, Blakemore C, Rakic P. Development of the human cerebral cortex: Boulder Committee revisited. Nat Rev Neurosci. 2008;9:110–122. - PubMed
    1. Rakic P. Specification of cerebral cortical areas. Science. 1988;241:170–176. - PubMed
    1. Takahashi T, Goto T, Miyama S, Nowakowski RS, Caviness VS., Jr Sequence of neuron origin and neocortical laminar fate: relation to cell cycle of origin in the developing murine cerebral wall. J Neurosci. 1999;19:10357–10371. - PMC - PubMed
    1. Noctor SC, Martínez-Cerdeño V, Ivic L, Kriegstein AR. Cortical neurons arise in symmetric and asymmetric division zones and migrate through specific phases. Nat Neurosci. 2004;7:136–144. - PubMed

Publication types

Associated data