. 2011 Aug 30;108(35):14584-9.
doi: 10.1073/pnas.1112188108. Epub 2011 Aug 22.

Mobilization of natural killer cells inhibits development of collagen-induced arthritis

Affiliations

Mobilization of natural killer cells inhibits development of collagen-induced arthritis

Jianmei W Leavenworth et al. Proc Natl Acad Sci U S A. .

Abstract

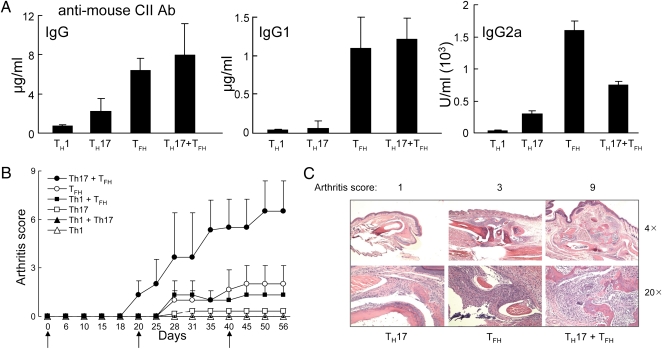
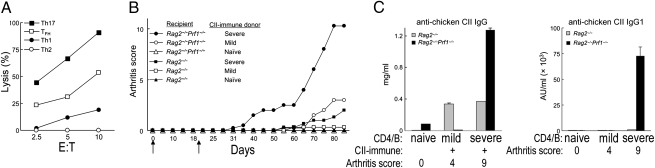
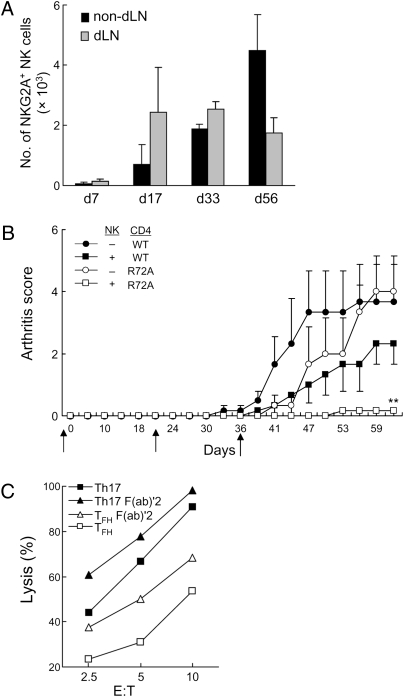
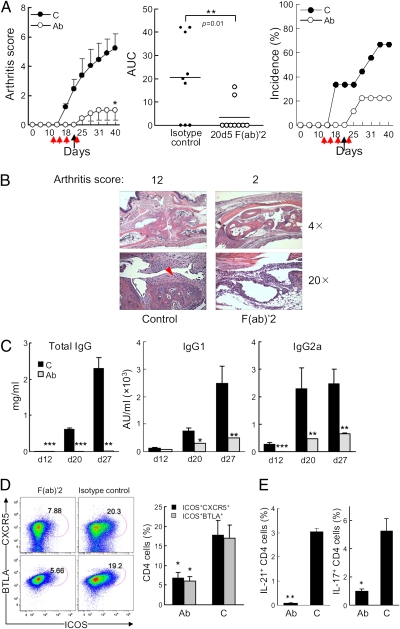
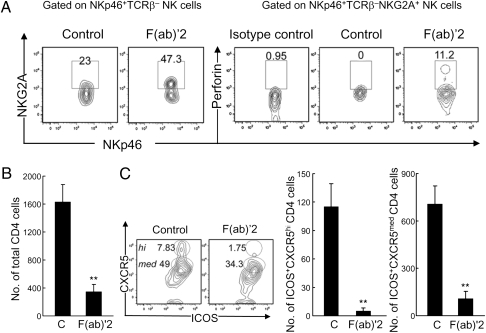
Although natural killer (NK) cells have been implicated in regulating immune responses, their ability to modulate disease development in autoimmune arthritis has not been analyzed. Here we investigate the contribution of NK cells to regulating collagen-induced arthritis, a well-characterized preclinical model of human rheumatoid arthritis. We find that the disease is induced by the combined action of two CD4(+) T helper (T(H)) subsets: follicular T(H) cells and T(H)17 cells. Both CD4(+) T(H) subsets are highly susceptible to lysis by NK cells after activation. Administration of antibody that activates NK cells through blockade of its inhibitory CD94/NKG2A receptor allows enhanced elimination of pathogenic follicular T(H) and T(H)17 cells and arrest of disease progression. These results suggest that antibody-dependent enhancement of NK activity may yield effective, previously undescribed therapeutic approaches to this autoimmune disorder.


Conflict of interest statement

The authors declare no conflict of interest.

Figures

Fig. 1.
Fig. 1.
The contribution of TH17 and TFH cells to CIA. ICOS+CXCR5+BTLA+CD25CD4+ TFH cells were FACS-sorted from arthritic mice (score = 12) and TH1 and TH17 cells were generated in vitro after stimulation with chicken CII. Each TH cell subset (2 × 10⁶) or mixtures of the indicated TH subsets (106 each) were cotransferred with B cells (4 × 10⁶) into Rag2−/−Prf1−/− mice followed by CII immunization and boosting at d 21 and 40. (A) Serum Ig and autoantibody titers (anti-mouse CII) were measured at d 45. (B) Arthritis scores of three mice per group are shown. Arrows indicate CII immunization and boosting. (C) Representative images of joint histology along with the arthritis score are shown for mice given the indicated TH subsets. Data represent one of three identical experiments.
Fig. 2.
Fig. 2.
The contribution of NK cells to regulation of CIA. (A) IL-2–expanded NK cells were incubated for 4 h with CII-specific TH subsets (induced in vitro) at the indicated E:T ratios. Percent lysis is shown. (B) Purified CD4 cells (lacking CD25+CD4+ Treg) and B cells from arthritic mice with indicated disease severity were transferred into Rag2−/−Prf1−/− (n = 4 per transfer) or Rag2−/− hosts (n = 3 per transfer). Arthritis was induced as described and scores are shown. Naïve, score = 0; mild, score= 2–4; severe, score = 10–12. Arrows indicate CII immunization and boosting. (C) Serum anti-chicken CII IgG and IgG1 titers were measured at d 45 and represent one of three identical experiments for B and C.
Fig. 3.
Fig. 3.
Regulation of NK cell activity through a CD94/NKG2A–Qa-1 interaction. (A) Numbers of NKG2A+ NK cells from draining LNs (dLNs) and nondraining LNs (nondLNs) during CIA development are shown for groups of three mice for each time point. (B) Purified CD4+ T cells (depleted of CD25+CD4+ Treg) from arthritic B6.WT or B6.Qa1 R72A mice were transferred into Rag2−/−Prf1−/− hosts along with B6.WT B cells. In some cases, sorted B6.WT NK cells were transferred into hosts before infusion of CD4 and B cells. Mice were immunized and boosted with CII at d 21 and 36 (black arrows). **P < 0.01. Arthritis scores are shown for adoptive hosts (three per transfer). (C) IL-2–expanded NK cells were preincubated with 10 μg⋅mL−1 20d5 F(ab)′2 for 1 h at 37 °C followed by incubation for 4 h with in vitro-differentiated CII-specific TH subsets at the indicated E:T ratios. Percent lysis is shown.
Fig. 4.
Fig. 4.
The efficacy of anti-NKG2A F(ab)′2 treatment of CIA. (A Left) CIA was induced in B6.WT mice as described in Materials and Methods. 200 μg of 20d5 F(ab)′2 anti-NKG2A (Ab) or 2A3 F(ab)′2 isotype control Ab (C) was given i.p. at the indicated times (red arrows: d 12, 15, 18, and 22; black arrows indicate CII boost). n = 9 mice per group; Student's t test: *P = 0.02 of two groups. (Center) Area under the curve (AUC) of individual mouse in A Left from the outset of treatment (**P < 0.01, Mann-Whitney test). (Right) Disease incidence is shown. Data represent at least five independent experiments. (B) Representative images of joint histology are shown. Red arrowhead indicates pannus formation. (C) Serum titers of anti-chicken CII IgG, IgG1, and IgG2a are shown. ***P < 0.001; **P < 0.01. (D Left) Representative plots of TFH cells from nondLNs are shown. Comparisons are made between F(ab)′2-treated and control-treated mice. (Right) Statistical analyses are shown. n = 5 (isotype control) and n = 4 [F(ab)′2]; Student's’ t test: *P < 0.05. (E) Levels of intracellular IL-17 and -21 in total CD4 cells from nondLNs were compared and graphed. n = 5 (isotype control) and n = 4 [F(ab)′2]; Student's’ t test: *P < 0.05.
Fig. 5.
Fig. 5.
The contribution of anti-NKG2A F(ab)′2 treatment on CD4 cell and NK cell infiltration into joints. (A Left) Increased NKG2A+ NKp46+TCRβ NK cells in joints of B6 mice after F(ab)′2 treatment. (Right) Increased intracellular perforin expression in intraarticular NKG2A+ NK cells after F(ab)′2 treatment. Rat IGg2a Ab was used as isotype control for perforin staining. (B) Numbers of CD4+ cells in infiltrated joints of F(ab)′2-treated and control (C) B6 mice. (C Left) Representative plots of intraarticular ICOS+CXCR5+CD4+ (TFH) cells from both groups of mice (B) are shown. Numbers of ICOS+CXCR5hiCD4+ cells (Center) and ICOS+CXCR5medCD4+ cells (Right) are shown. Cells were isolated from paws and ankles pooled from three mice per group. Average arthritis score: control = 4; F(ab)′2 = 1. Data represent two separate experiments; error bars denote mean ± SE. Student's’ t test: **P < 0.01.

Comment in

References

    1. Gabriel SE, Michaud K. Epidemiological studies in incidence, prevalence, mortality, and comorbidity of the rheumatic diseases. Arthritis Res Ther. 2009;11:229. - PMC - PubMed
    1. Cho YG, Cho ML, Min SY, Kim HY. Type II collagen autoimmunity in a mouse model of human rheumatoid arthritis. Autoimmun Rev. 2007;7:65–70. - PubMed
    1. Asquith DL, Miller AM, McInnes IB, Liew FY. Animal models of rheumatoid arthritis. Eur J Immunol. 2009;39:2040–2044. - PubMed
    1. Bevaart L, Vervoordeldonk MJ, Tak PP. Evaluation of therapeutic targets in animal models of arthritis: How does it relate to rheumatoid arthritis? Arthritis Rheum. 2010;62:2192–2205. - PubMed
    1. Leipe J, et al. Role of Th17 cells in human autoimmune arthritis. Arthritis Rheum. 2010;62:2876–2885. - PubMed

Publication types

MeSH terms

Substances