

Bacterial community comparisons by taxonomy-supervised analysis independent of sequence alignment and clustering
- PMID: 21873204
- PMCID: PMC3167511
- DOI: 10.1073/pnas.1111435108
Bacterial community comparisons by taxonomy-supervised analysis independent of sequence alignment and clustering
Abstract
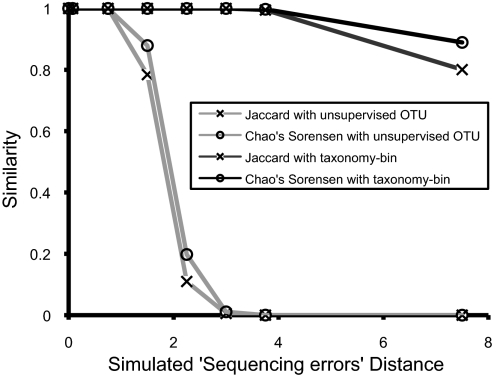
High-throughput sequencing of 16S rRNA genes has increased our understanding of microbial community structure, but now even higher-throughput methods to the Illumina scale allow the creation of much larger datasets with more samples and orders-of-magnitude more sequences that swamp current analytic methods. We developed a method capable of handling these larger datasets on the basis of assignment of sequences into an existing taxonomy using a supervised learning approach (taxonomy-supervised analysis). We compared this method with a commonly used clustering approach based on sequence similarity (taxonomy-unsupervised analysis). We sampled 211 different bacterial communities from various habitats and obtained ∼1.3 million 16S rRNA sequences spanning the V4 hypervariable region by pyrosequencing. Both methodologies gave similar ecological conclusions in that β-diversity measures calculated by using these two types of matrices were significantly correlated to each other, as were the ordination configurations and hierarchical clustering dendrograms. In addition, our taxonomy-supervised analyses were also highly correlated with phylogenetic methods, such as UniFrac. The taxonomy-supervised analysis has the advantages that it is not limited by the exhaustive computation required for the alignment and clustering necessary for the taxonomy-unsupervised analysis, is more tolerant of sequencing errors, and allows comparisons when sequences are from different regions of the 16S rRNA gene. With the tremendous expansion in 16S rRNA data acquisition underway, the taxonomy-supervised approach offers the potential to provide more rapid and extensive community comparisons across habitats and samples.
Conflict of interest statement
The authors declare no conflict of interest.
Figures
References
Publication types
MeSH terms
Substances
Grants and funding
LinkOut - more resources
Full Text Sources
Other Literature Sources
