

Optical imaging in galagos reveals parietal-frontal circuits underlying motor behavior
- PMID: 21873212
- PMCID: PMC3174626
- DOI: 10.1073/pnas.1109925108
Optical imaging in galagos reveals parietal-frontal circuits underlying motor behavior
Abstract
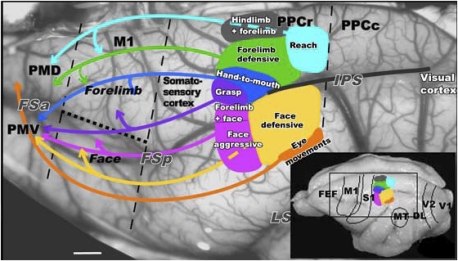
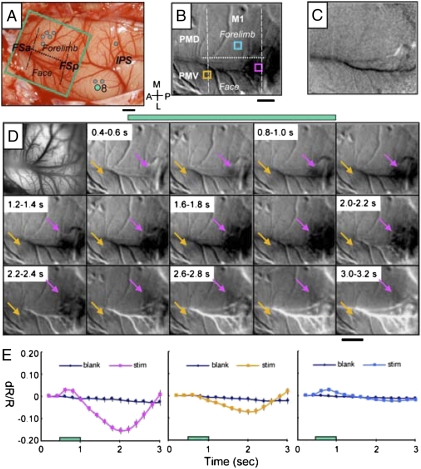
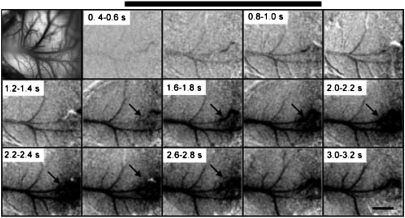
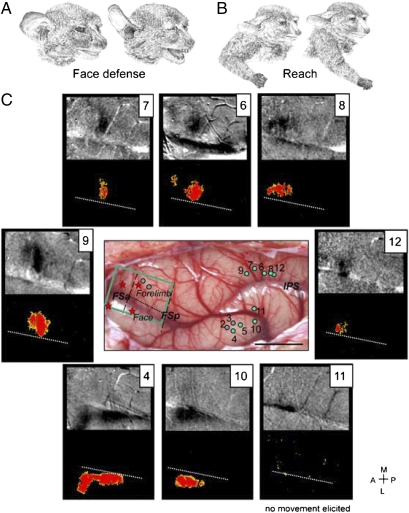
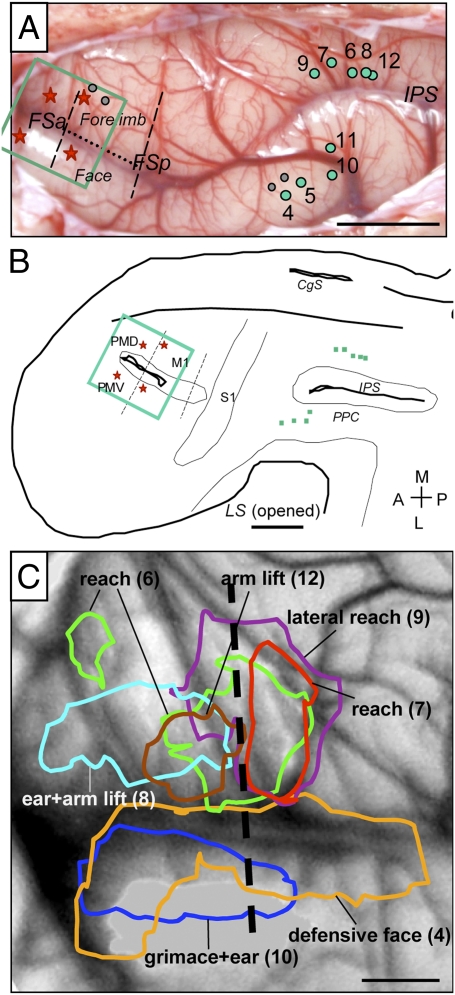
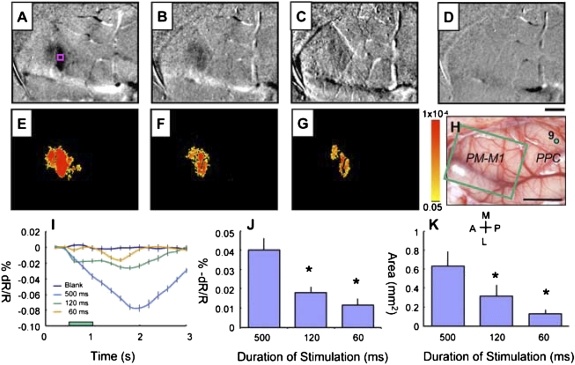
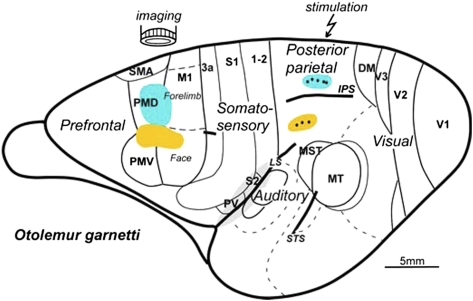
The posterior parietal cortex (PPC) of monkeys and prosimian galagos contains a number of subregions where complex, behaviorally meaningful movements, such as reaching, grasping, and body defense, can be evoked by electrical stimulation with long trains of electrical pulses through microelectrodes. Shorter trains of pulses evoke no or simple movements. One possibility for the difference in effectiveness of intracortical microstimulation is that long trains activate much larger regions of the brain. Here, we show that long-train stimulation of PPC does not activate widespread regions of frontal motor and premotor cortex but instead, produces focal, somatotopically appropriate activations of frontal motor and premotor cortex. Shorter stimulation trains activate the same frontal foci but less strongly, showing that longer stimulus trains do not produce less specification. Because the activated sites in frontal cortex correspond to the locations of direct parietal-frontal anatomical connections from the stimulated PPC subregions, the results show the usefulness of optical imaging in conjunction with electrical stimulation in showing functional pathways between nodes in behavior-specific cortical networks. Thus, long-train stimulation is effective in evoking ethologically relevant sequences of movements by activating nodes in a cortical network for a behaviorally relevant period rather than spreading activation in a nonspecific manner.
Conflict of interest statement
The authors declare no conflict of interest.
Figures
Similar articles
-
Evolution of posterior parietal cortex and parietal-frontal networks for specific actions in primates.J Comp Neurol. 2016 Feb 15;524(3):595-608. doi: 10.1002/cne.23838. Epub 2015 Jul 21. J Comp Neurol. 2016. PMID: 26101180 Free PMC article. Review.
-
Microstimulation reveals specialized subregions for different complex movements in posterior parietal cortex of prosimian galagos.Proc Natl Acad Sci U S A. 2005 Mar 29;102(13):4878-83. doi: 10.1073/pnas.0501048102. Epub 2005 Mar 16. Proc Natl Acad Sci U S A. 2005. PMID: 15772167 Free PMC article.
-
Interactions within and between parallel parietal-frontal networks involved in complex motor behaviors in prosimian galagos and a squirrel monkey.J Neurophysiol. 2020 Jan 1;123(1):34-56. doi: 10.1152/jn.00576.2019. Epub 2019 Nov 6. J Neurophysiol. 2020. PMID: 31693452 Free PMC article.
-
Organization of the posterior parietal cortex in galagos: II. Ipsilateral cortical connections of physiologically identified zones within anterior sensorimotor region.J Comp Neurol. 2009 Dec 20;517(6):783-807. doi: 10.1002/cne.22190. J Comp Neurol. 2009. PMID: 19844952 Free PMC article.
-
Cortical networks for ethologically relevant behaviors in primates.Am J Primatol. 2013 May;75(5):407-14. doi: 10.1002/ajp.22065. Epub 2012 Aug 3. Am J Primatol. 2013. PMID: 22865408 Free PMC article. Review.
Cited by
-
Evolution of posterior parietal cortex and parietal-frontal networks for specific actions in primates.J Comp Neurol. 2016 Feb 15;524(3):595-608. doi: 10.1002/cne.23838. Epub 2015 Jul 21. J Comp Neurol. 2016. PMID: 26101180 Free PMC article. Review.
-
Reversible Deactivation of Motor Cortex Reveals Functional Connectivity with Posterior Parietal Cortex in the Prosimian Galago (Otolemur garnettii).J Neurosci. 2015 Oct 21;35(42):14406-22. doi: 10.1523/JNEUROSCI.1468-15.2015. J Neurosci. 2015. PMID: 26490876 Free PMC article.
-
In Vivo Mapping of Cortical Columnar Networks in the Monkey with Focal Electrical and Optical Stimulation.Front Neuroanat. 2015 Nov 16;9:135. doi: 10.3389/fnana.2015.00135. eCollection 2015. Front Neuroanat. 2015. PMID: 26635539 Free PMC article. Review.
-
Cortical connections of the functional domain for climbing or running in posterior parietal cortex of galagos.J Comp Neurol. 2021 Jul 1;529(10):2789-2812. doi: 10.1002/cne.25123. Epub 2021 Mar 4. J Comp Neurol. 2021. PMID: 33550608 Free PMC article.
-
Infrared neural stimulation of primary visual cortex in non-human primates.Neuroimage. 2014 Jan 1;84:181-90. doi: 10.1016/j.neuroimage.2013.08.040. Epub 2013 Aug 28. Neuroimage. 2014. PMID: 23994125 Free PMC article.
References
-
- Rizzolatti G, Fogassi L, Gallese V. Parietal cortex: From sight to action. Curr Opin Neurobiol. 1997;7:562–567. - PubMed
-
- Rizzolatti G, Luppino G. The cortical motor system. Neuron. 2001;31:889–901. - PubMed
-
- Sakata H, Taira M, Murata A, Mine S. Neural mechanisms of visual guidance of hand action in the parietal cortex of the monkey. Cereb Cortex. 1995;5:429–438. - PubMed
-
- Buneo CA, Andersen RA. The posterior parietal cortex: Sensorimotor interface for the planning and online control of visually guided movements. Neuropsychologia. 2006;44:2594–2606. - PubMed
-
- Andersen RA, Brotchie PR, Mazzoni P. Evidence for the lateral intraparietal area as the parietal eye field. Curr Opin Neurobiol. 1992;2:840–846. - PubMed
Publication types
MeSH terms
Grants and funding
LinkOut - more resources
Full Text Sources
