. 2011 Sep 6;108(36):15004-9.
doi: 10.1073/pnas.1013171108. Epub 2011 Aug 22.

Random partitioning of molecules at cell division

Affiliations

Random partitioning of molecules at cell division

Dann Huh et al. Proc Natl Acad Sci U S A. .

Abstract

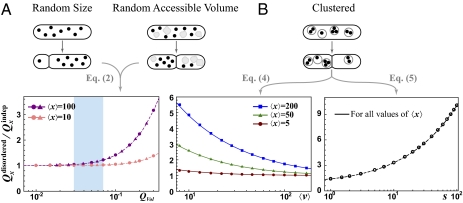
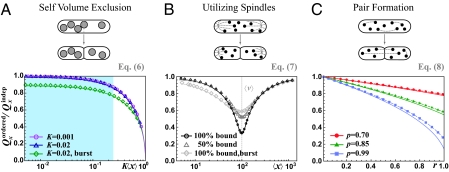
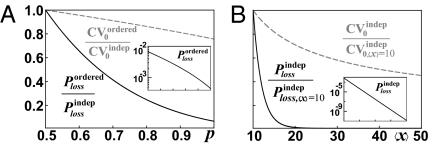
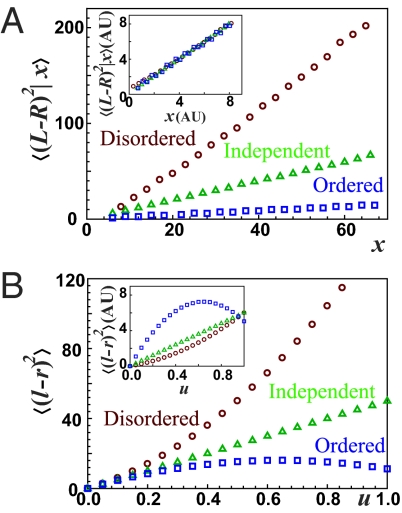
Many RNAs, proteins, and organelles are present in such low numbers per cell that random segregation of individual copies causes large "partitioning errors" at cell division. Even symmetrically dividing cells can then by chance produce daughters with very different composition. The size of the errors depends on the segregation mechanism: Control systems can reduce low-abundance errors, but the segregation process can also be subject to upstream sources of randomness or spatial heterogeneities that create large errors despite high abundances. Here we mathematically demonstrate how partitioning errors arise for different types of segregation mechanisms and how errors can be greatly increased by upstream heterogeneity but remarkably hard to avoid through controlled partitioning. We also show that seemingly straightforward experiments cannot be straightforwardly interpreted because very different mechanisms produce identical fits and present an approach to deal with this problem by adding binomial counting noise and testing for convexity or concavity in the partitioning error as a function of the binomial thinning parameter. The results lay a conceptual groundwork for more effective studies of heterogeneity among growing and dividing cells, whether in microbes or in differentiating tissues.


Conflict of interest statement

The authors declare no conflict of interest.

Figures

Fig. 1.
Fig. 1.
Disordered segregation can increase partitioning errors greatly. (A) Upper: Variation in division site or random segregation of other large components causes fluctuations in daughter size or in the volume accessible to the segregating component. Lower: In simulations (symbols) x is picked from Poisson distributions and volume variation is generated by assuming either (truncated) Gaussian variation in the size (circles) or random segregation of another large component (triangle), where QVol is determined numerically. The exact analytical curve is dashed. The shaded area corresponds to experimental results for many microbes where 3% < QVol < 7% (–29). (B) Upper: Segregating molecules (dots) are randomly grouped into vesicles (gray circles) and the vesicles are independently partitioned into daughter cells. Lower: Simulation results (symbols) and analytical expressions that are approximate (solid lines) and exact (dashed line) for cases of Eqs. 4 and 5, respectively. For the case of Eq. 4, x and v are sampled from Poisson distributions. For the case of Eq. 5, the value of v is first sampled from a Poisson distribution and x is then sampled from a Poisson distribution with average sv for each given v, so that q = 1; hence the second term of Eq. 5 is zero in this example. Simulations using different average 〈x〉 produce indistinguishable plots for virtually all values of 〈x〉 (SI Text).
Fig. 2.
Fig. 2.
Ordered segregation requires extreme parameters to substantially reduce partitioning errors. (A) Upper: Segregating units with nonnegligible size (gray circles) exclude each other and thereby promote more even segregation. Lower: Simulation results (symbols) and analytical approximation (solid lines) plotted as a function of the average total volume fraction occupied by the segregating units, with x sampled from Poisson distributions for each 〈x〉 (circles and triangles) or assuming that synthesis occurs in a geometric burst with average burst size of 10 (diamonds). All results are truncated to ensure Kx < 1. The shaded area corresponds to the physiological regime for most cellular components (34) and shows that the effect should be minor. (B) Upper: Organelles (dots) compete for available binding sites (ends of astral, gray) and unbound organelles are partitioned independently. Lower: Simulation results (symbols) and analytical approximations (solid lines) when binding sites are distributed evenly between the two daughters. The circles and triangles correspond to v and x sampled from Poisson distributions, using 〈v〉 = 100, and diamonds show x and v sampled from processes where synthesis occurs in a geometrically distributed burst, with average burst sizes of 20 and 10 for v and x, respectively. The results show how modest the effects are when x and v are not exactly matched. (C) Upper: Among (xδx,odd)/2 possible pairs in each cell, a fraction r of molecules (dots) binomially forms pairs, where δx,odd = 1 if x is odd and zero otherwise. Paired molecules segregate separately with probability p whereas unpaired molecules segregate independently. Under these assumptions, k = r(1 − Po/〈x〉), where Po is the probability that x is an odd number. Lower: Simulations (symbols), exact analytical results (Eq. 8, dashed line), and analytical approximations (k = r in Eq. 8, solid line) when x is sampled from a Poisson distribution of average 10. The results show that both r and p must approach 100% for efficient control. Derivations are given in SI Text.
Fig. 3.
Fig. 3.
Ordered segregation and increased averages can dramatically reduce the rate of complete loss. (A) Relative reduction of the probability Ploss that all units segregate to the same daughter (solid line), as well as CV0 (dashed line), comparing ordered vs. independent segregation. We assume that 90% of the units form pairs (r = 0.9 model in Fig. 2C), and x is sampled from a Poisson distribution with mean 10. (B) Relative reduction of the loss rate and CV0 with the average number of molecules, again calculated assuming a Poisson distribution for x. Insets: Absolute loss rates Ploss as functions of p and 〈x〉, respectively. Derivations are given in SI Text.
Fig. 4.
Fig. 4.
Segregation mechanisms are difficult to infer. (A) Examples of ordered, disordered, and independent segregation mechanisms were simulated, and the conditional mean-squared error, given x copies in the mother cell, was plotted as a function of x. This measure is closely related to the partitioning error and was used to interpret experiments for protein segregation in E. coli (20). To illustrate disordered segregation we used the second case of Fig. 1B (Eq. 5) where the number v of vesicles is sampled from a Poisson distribution with average of 25, and x is sampled from a Poisson distribution with average 2v for each given v; hence 〈x | v〉 = 2v. To illustrate ordered segregation we used the pairing mechanism of Fig. 2C, with r = 0.8 and p = 0.99. All three curves are nearly perfectly approximated by 〈(LR)2 | x〉 = ax. Inset: When levels are measured in arbitrary units, and the three mechanisms are assayed in separate experiments (different units), the curves are indistinguishable and can be laid on top of each other. Each mechanism thus fits the other datasets equally well. (B) Segregation mechanisms can be distinguished without counting the units by utilizing photoconvertible proteins. As the fraction of conversion (u) increases, the partitioning errors of the photoconverted molecules show convex, concave, and straight curves for disordered, ordered, and independent partitioning, respectively. All parameters are the same as in A with 〈x〉 = 50. Inset: The same scaling as in the Inset of A is applied to make the fluorescent level arbitrary, and the shapes of the curves allow us to distinguish the partitioning mechanism.

References

    1. Warren G. Membrane partitioning during cell division. Annu Rev Biochem. 1993;62:323–348. - PubMed
    1. Marshall WF. Stability and robustness of an organelle number control system: Modeling and measuring homeostatic regulation of centriole abundance. Biophys J. 2007;93:1818–1833. - PMC - PubMed
    1. Birky CW., Jr The partitioning of cytoplasmic organelles at cell division. Int Rev Cytol Suppl. 1983;15:49–89. - PubMed
    1. Nordström K, Austin SJ. Mechanisms that contribute to the stable segregation of plasmids. Annu Rev Genet. 1989;23:37–69. - PubMed
    1. Ozbudak EM, Thattai M, Kurtser I, Grossman AD, van Oudenaarden A. Regulation of noise in the expression of a single gene. Nat Genet. 2002;31:69–73. - PubMed

Publication types

MeSH terms

LinkOut - more resources