. 2011 Oct 21;286(42):36532-49.
doi: 10.1074/jbc.M111.237578. Epub 2011 Aug 26.

Neu1 sialidase and matrix metalloproteinase-9 cross-talk is essential for Toll-like receptor activation and cellular signaling

Affiliations

Neu1 sialidase and matrix metalloproteinase-9 cross-talk is essential for Toll-like receptor activation and cellular signaling

Samar Abdulkhalek et al. J Biol Chem. .

Abstract

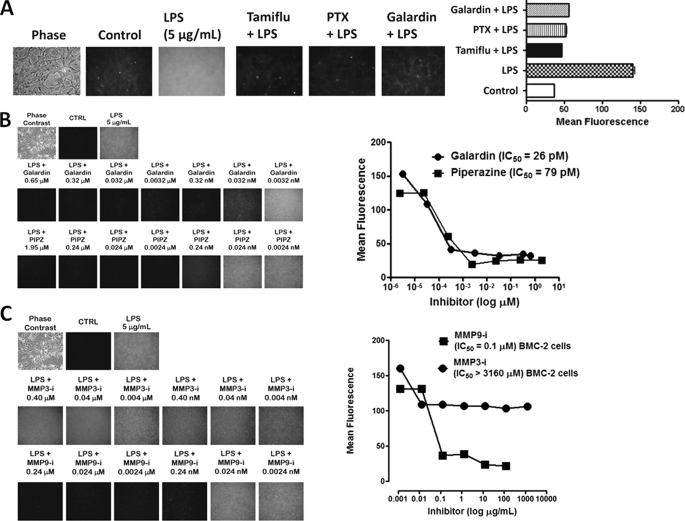
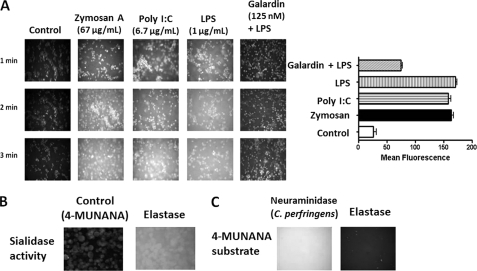
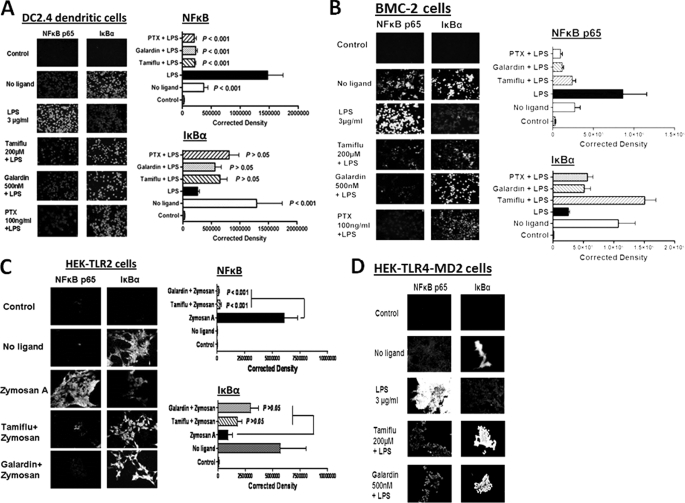
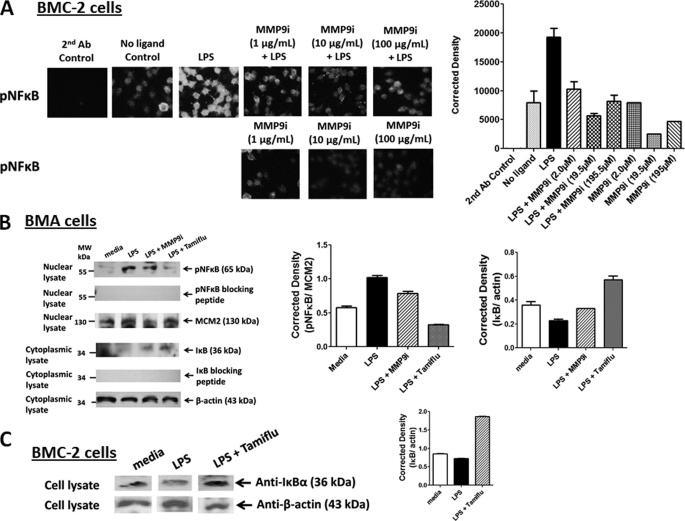
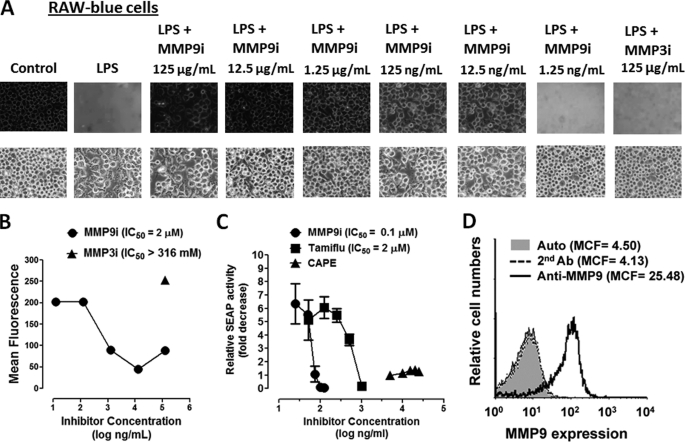
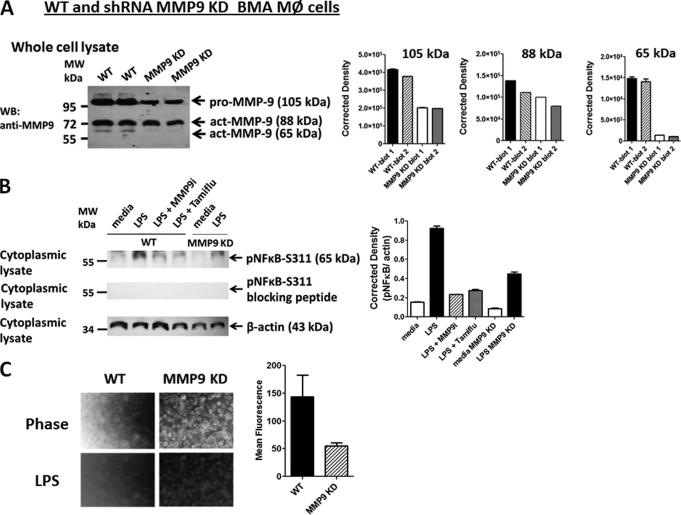
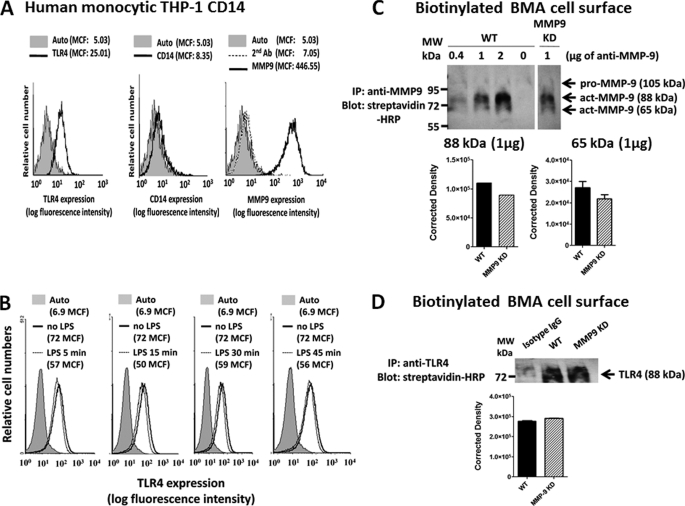
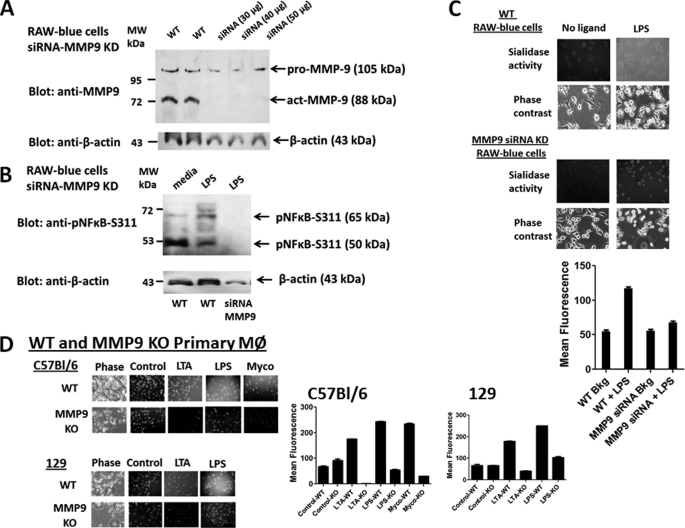
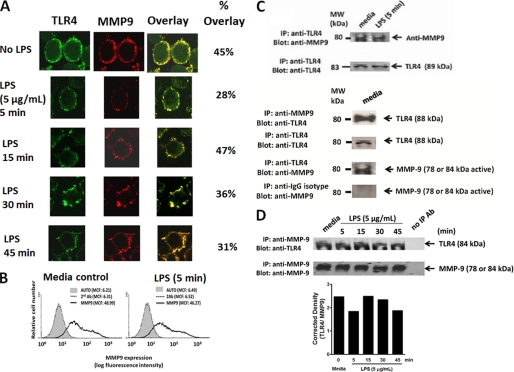
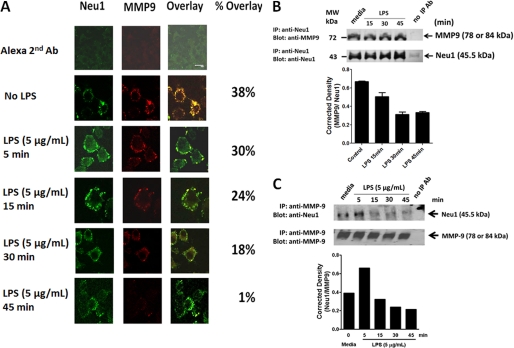
The signaling pathways of mammalian Toll-like receptors (TLRs) are well characterized, but the precise mechanism(s) by which TLRs are activated upon ligand binding remains poorly defined. Recently, we reported a novel membrane sialidase-controlling mechanism that depends on ligand binding to its TLR to induce mammalian neuraminidase-1 (Neu1) activity, to influence receptor desialylation, and subsequently to induce TLR receptor activation and the production of nitric oxide and proinflammatory cytokines in dendritic and macrophage cells. The α-2,3-sialyl residue of TLR was identified as the specific target for hydrolysis by Neu1. Here, we report a membrane signaling paradigm initiated by endotoxin lipopolysaccharide (LPS) binding to TLR4 to potentiate G protein-coupled receptor (GPCR) signaling via membrane Gα(i) subunit proteins and matrix metalloproteinase-9 (MMP9) activation to induce Neu1. Central to this process is that a Neu1-MMP9 complex is bound to TLR4 on the cell surface of naive macrophage cells. Specific inhibition of MMP9 and GPCR Gα(i)-signaling proteins blocks LPS-induced Neu1 activity and NFκB activation. Silencing MMP9 mRNA using lentivirus MMP9 shRNA transduction or siRNA transfection of macrophage cells and MMP9 knock-out primary macrophage cells significantly reduced Neu1 activity and NFκB activation associated with LPS-treated cells. These findings uncover a molecular organizational signaling platform of a novel Neu1 and MMP9 cross-talk in alliance with TLR4 on the cell surface that is essential for ligand activation of TLRs and subsequent cellular signaling.


Figures

FIGURE 1.
FIGURE 1.
A, LPS-induced sialidase activity is blocked by specific GPCR Gαi subunit and MMP inhibitors in live HEK-TLR4/MD2 cells. Cells were incubated on 12-mm circular glass slides in conditioned medium for 24 h at 37 °C in a humidified incubator. After removal of medium, 0.2 mm 4-MUNANA (4-MU) substrate in Tris-buffered saline, pH 7.4, was added with mounting medium to cells alone (Control), with 5 μg/ml LPS, or with LPS in combination with 250 μg/ml Tamiflu, 500 nm galardin, or 25 ng/ml PTX. Fluorescent images were taken at 1-min intervals using epifluorescent microscopy (×40 objective). The mean fluorescence surrounding the cells for each of the images was measured using ImageJ software. The data are a representation of one of six independent experiments showing similar results. Error bars, S.E. B, LPS-induced sialidase activity in live BMC-2 macrophages is inhibited by galardin and piperazine in a dose-dependent manner. After removing medium, 0.2 mm 4-MUNANA substrate in Tris-buffered saline, pH 7.4, was added to cells alone (CTRL), with 5 μg/ml LPS, or with LPS in combination with galardin (GM6001) or piperazine (PIPZ, MMP inhibitor II) at the indicated concentrations. Fluorescent images were taken at 1 min after adding substrate using epifluorescent microscopy (×40 objective). The IC50 of each compound was determined by plotting the decrease in sialidase activity against the log of the agent concentration. The data are a representation of one of three independent experiments showing similar results. C, MMP9i but not MMP3i blocks LPS-induced sialidase activity in BMC-2 macrophages. Images are as described in A. Data analyses are as described in B. The data are a representation of one of three independent experiments showing similar results.
FIGURE 2.
FIGURE 2.
A, zymosan A, poly(I:C), and LPS induce MMP activity in live BMC-2 cells, which is inhibited by galardin. BMC-2 macrophage cells were allowed to adhere on 12-mm circular glass slides in medium containing 10% fetal calf serum for 24 h at 37 °C in a humidified incubator. After removing medium, 0.91 mm OmniMMPTM fluorogenic substrate (Mca-Pro-Leu-Gly-Leu-Dpa-Ala-Arg-NH2·AcOH) in 20 μg/ml DMSO was added to cells alone (Control) or in combination with either 66.7 μg/ml zymosan A, 6.7 μg/ml poly(I:C), 1 μg/ml LPS, or LPS in combination with 125 nm galardin (GM6001). The OmniMMPTM substrate is hydrolyzed by MMP enzymes. Mca fluorescence is quenched by the Dpa group. MMP cleaves Gly-Leu of the OmniMMPTM substrate, releasing the Mca residue. Mca has a fluorescence emission at 393 nm following excitation at 328 nm. Fluorescent images were taken at 1 min after adding substrate using epifluorescent microscopy (×40 objective). The mean fluorescence for each of the images was measured using ImageJ software. The data are a representation of one of three independent experiments showing similar results. Error bars, S.E. B, exogenous elastase induces sialidase activity in DC2.4 dendritic cells. Cells were grown on 12-mm circular glass slides in medium containing 10% fetal calf serum for 24 h at 37 °C in a humidified incubator. After removing medium, 2.04 mm 4-MUNANA substrate was added to each well alone (Control) or with 100 μg/ml pure elastase. Fluorescent images were taken at 1 min after adding substrate using epifluorescent microscopy (×40 objective). A positive control sialidase (from C. perfringens; specific activity of 1 unit/1.0 mmol of N-acetylneuraminic acid/min) or pure elastase (C) was added to 2.04 mm 4-MUNANA substrate alone. Fluorescent images were taken at 1 min after adding substrate using epifluorescent microscopy (×40 objective).
FIGURE 3.
FIGURE 3.
A, LPS-induced NFκB activation and IκB degradation in DC2.4 dendritic cells. DC2.4 cells were pretreated with 200 μm Tamiflu, 500 nm galardin, 100 ng/ml PTX for 30 min followed by 3 μg/ml LPS for 15 min. Cells were fixed, permeabilized, and immunostained with rabbit anti-NFκBp65 or rabbit anti-IκBα followed by Alexa Fluor594 rabbit anti-goat IgG. Stained cells were visualized by epifluorescence microscopy using a ×40 objective. Approximately 95% of LPS-treated cells immunostained with NFκBp65 had nuclear staining. Quantitative analysis was done by assessing the density of cell staining corrected for background in each panel using Corel Photo Paint 8.0 software. Each bar in the graphs represents the mean corrected density of staining ± S.E. (error bars) for all cells within the respective images. The control group was immunostained with only Alexa Fluor594 secondary goat anti-rabbit IgG. p values represent significant differences at 95% confidence using the Dunnett multiple comparison test compared with LPS-treated cells. The data are a representation of one of three independent experiments showing similar results. B, LPS-induced NFκB activation and IκB degradation in BMC-2 macrophage cells. Cells were cultured and treated as described in A. C, zymosan A-induced NFκB activation and IκB degradation in HEK-TLR2 cells. Cells were pretreated with 200 μm Tamiflu or 500 nm galardin for 30 min followed by 66.7 μg/ml zymosan A for 15 min. Cells were fixed, permeabilized, and immunostained as described in A. D, LPS-induced NFκB activation and IκB degradation in HEK-TLR4/MD2 cells. Cells were cultured and treated as described in A.
FIGURE 4.
FIGURE 4.
A, endotoxin LPS induces phosphorylated NFκBp65 Ser(P)529 (pNFκB) in BMC-2 macrophage cells. Cells were cultured on circular glass slides in 24-well tissue culture plates in medium containing 10% fetal calf serum for 24 h at 37 °C in a humidified incubator. Cells were pretreated with the indicated concentrations of MMP9i, in combination with 10 μg/ml LPS for 15 min or left untreated (no ligand). Cells were fixed, permeabilized, and immunostained with phospho-specific polyclonal rabbit antibody against the human NFκBp65 Ser(P)276 (pNFκB), followed by Alexa Fluor594 goat anti-rabbit IgG. Stained cells were visualized by epifluorescence microscopy using a ×40 objective. Quantitative analysis was done by assessing the density of cell staining corrected for background in each panel using Corel Photo Paint 8.0 software. Each bar in the graphs represents the mean corrected density of staining ± S.E. (error bars) for all cells within the respective images. The data are a representation of one of five independent experiments showing similar results. B, Western blot analyses of phosphorylated NFκB (Ser(P)311) in nuclear lysates. BMA macrophage cells were pretreated with 100 μg/ml MMP9i or 200 μm Tamiflu for 30 min followed by 5 μg/ml LPS. Nuclear lysates from the cells were separated by SDS-PAGE, and the blot was probed with phospho-specific polyclonal rabbit antibody against NFκBp65 Ser(P)311 with minimal reactivity with non-phosphorylated p65. Specific NFκBp65 Ser(P)311 blocking peptide was added to the anti-NFκBp65 Ser(P)311 antibody in probing the blot. MCM2 (highly conserved minichromosome maintenance complex protein-2) was used as an internal control protein for loading of the nuclear lysate. Cytoplasmic cell lysates from the same samples were separated by SDS-PAGE, and the blot was probed with anti-IκB antibody. Specific IκB blocking peptide was added to the anti-IκB antibody in probing the blot. β-actin was used as an internal control protein for loading of the cytoplasmic cell lysate. Quantitative analysis was done by assessing the density of a band corrected for background in each lane using Corel Photo Paint 8.0 software. Each bar in the graphs represents the mean ratio of NFκBp65 Ser(P)311 to MCM2 or mean ratio of IκB to β-actin of band density ± S.E. (error bars) for 5–10 replicate measurements. The data are a representation of one of three independent experiments showing similar results. C, Western blot analyses of IκB in cell lysates. BMC-2 macrophage cells were pretreated with 200 μm Tamiflu for 30 min followed by 5 μg/ml LPS. Cell lysates from the cells were separated by SDS-PAGE and the blot probed with anti-IκB antibody. β-Actin was used as an internal control protein for loading of the cytoplasmic cell lysate. Quantitative analysis was done by assessing the density of a band corrected for background in each lane using Corel Photo Paint 8.0 software. Each bar in the graphs represents the mean ratio of IκB to β-actin of band density ± S.E. (error bars) for 5–10 replicate measurements. The data are a representation of one of three independent experiments showing similar results.
FIGURE 5.
FIGURE 5.
A, MMP9i significantly inhibits LPS-induced sialidase activity in live RAW-Blue macrophage cells in a dose-dependent manner. LPS-induced sialidase activity in RAW-Blue cells was measured as described in the legend to Fig. 1A. Fluorescent images were taken at 2 min after adding 0.318 mm 4-MUNANA substrate together with LPS and the indicated MMP inhibitors (MMP9i and MMP3i) using epifluorescent microscopy (Zeiss Imager M2, ×40 objective). The mean fluorescence surrounding the cells for each of the images was measured using ImageJ Software. The data are a representation of one of three independent experiments showing similar results. B, the 50% inhibition concentration (IC50) for MMP9i and MMP3i on sialidase activity induced by LPS in live RAW-Blue cells. Cells were treated with 5 μg/ml LPS in the presence or absence of different concentrations of the indicated inhibitors and 0.318 mm 4-MUNANA substrate using epifluorescent microscopy (×40 objective) as described in A. The IC50 of MMP9i compound was determined by plotting the decrease in sialidase activity against the log of the agent concentration. There was no inhibitory effect of MMP3i at 125 μg/ml. C, Tamiflu and MMP9i inhibit NFκB-dependent SEAP activity. SEAP reporter-expressing RAW-Blue cells were treated with different doses of Tamiflu, MMP inhibitor, or caffeic acid phenethyl ester (CAPE; a known inhibitor of NFκB) for 24 h, and SEAP activity in the culture medium was assessed using Quanti-blue substrate. Results are representative of three experiments. Relative SEAP activity was calculated as -fold increase of each compound (SEAP activity in medium from treated cells minus no cell background over SEAP activity in medium from untreated cells minus background). The IC50 of each compound was determined by plotting the decrease in SEAP activity against the log of the agent concentration. The data are a representation of one of three independent experiments showing similar results. D, flow cytometry analysis of MMP9 expression on the cell surface of live RAW-Blue cells. Histograms show staining with rabbit anti-MMP9 antibody after incubation on ice for 15 min followed by Alexa Fluor488-conjugated F(ab′)2 secondary goat anti-rabbit IgG for an additional 15 min on ice. Control cells were stained with Alexa Fluor488-conjugated F(ab′)2 secondary antibody for 15 min on ice or untreated cells (auto). Cells were analyzed by Beckman Coulter Epics XL-MCL flow cytometry and Expo32 ADC software (Beckman Coulter). Overlay histograms are displayed. Live untreated cells (auto) are represented by a gray-filled histogram. Control Alexa Fluor488 secondary antibody-treated live cells are represented by the unfilled gray dashed line. Live cells stained with antibody against MMP9 are depicted by the unfilled histogram with the black line. The mean channel fluorescence (MCF) for each histogram is indicated for 40,000 acquired cells (80% gated). The data are a representation of one of three independent experiments showing similar results.
FIGURE 6.
FIGURE 6.
A, Western blot analysis of silencing MMP9 mRNA using lentiviral MMP9 shRNA. MMP9 shRNA (mouse) transduction-ready lentiviral particles (multiplicity of infection = 6) contain three target-specific constructs that encode 19–25-nt (plus hairpin) shRNA designed to knock down MMP9 gene expression (MMP9 KD). WT and MMP9 KD BMA macrophage cells were cultured in DMEM conditioned selection medium containing 10% FCS, 5 μg/ml plasmocin, and optimal 2 μg/ml puromycin. Cell lysates from untreated cells were separated by SDS-PAGE, and the blot was probed with anti-MMP9 antibody. Quantitative analysis was done by assessing the density of a band corrected for background in each lane using Corel Photo Paint 8.0 software. Each bar in the graphs represents the mean of band density ± S.E. (error bars) for 5–10 replicate measurements. B, Western blot analysis of LPS-induced phosphorylated NFκB (Ser(P)311) in cytoplasmic cell lysates. WT macrophage cells were pretreated with 100 μg/ml MMP9i or 200 μm Tamiflu for 30 min followed by 5 μg/ml LPS. MMP9 KD BMA cells were treated with 5 μg/ml LPS or left untreated as medium control. Cell lysates from the WT and MMP9 KD BMA cells were separated by SDS-PAGE, and the blot was probed with phospho-specific polyclonal rabbit antibody against NFκBp65 Ser(P)311 with minimal reactivity with non-phosphorylated p65. Specific NFκBp65 Ser(P)311 blocking peptide was added to the anti-NFκBp65 Ser(P)311 antibody in probing the blot. β-Actin was used as an internal control protein for loading of the cytoplasmic cell lysate. Quantitative analysis was done by assessing the density of a band corrected for background in each lane using Corel Photo Paint 8.0 software. Each bar in the graphs represents the mean ratio of NFκBp65 Ser(P)311 to β-actin of band density ± S.E. (error bars) for 5–10 replicate measurements. The data are a representation of one of three independent experiments showing similar results. C, LPS-induced sialidase activity in live WT and MMP9 KD BMA macrophage cells. After removing medium, 0.2 mm 4-MUNANA substrate in Tris-buffered saline, pH 7.4, was added to cells alone (control) or with 5 μg/ml LPS. Fluorescent images were taken at 1 min after adding substrate using epifluorescent microscopy (×40 objective). The mean fluorescence surrounding the cells for each of the images was measured using ImageJ software. The data show two separate experiments showing similar results.
FIGURE 7.
FIGURE 7.
A, flow cytometry analysis of MMP9 expression on the cell surface of live human monocytic CD14-THP1 cells. Histograms show staining with FITC-conjugated anti-TLR4 antibody, R-phycoerythrin (R-PE)-conjugated anti-CD14 antibody, or rabbit anti-MMP9 antibodies after incubation on ice for 15 min followed by Alexa Fluor488-conjugated F(ab′)2 secondary goat anti-rabbit IgG for an additional 15 min on ice. Control cells were stained with Alexa Fluor488-conjugated F(ab′)2 secondary antibody for 15 min on ice or untreated cells (Auto). Cells were analyzed by Beckman Coulter Epics XL-MCL flow cytometry and Expo32 ADC software (Beckman Coulter). Overlay histograms are displayed. Live untreated cells are represented by a gray-filled histogram. Control Alexa Fluor488 secondary antibody-treated live cells are represented by the unfilled gray dashed line. Live cells stained with antibody against TLR4, CD14, or MMP9 are depicted by the unfilled histogram with the black line. The mean channel fluorescence (MCF) for each histogram is indicated for 40,000 acquired cells (80% gated). B, flow cytometry analysis of TLR4 expressed on the cell surface of live human monocytic CD14-THP1 cells following LPS treatment for 5, 15, 30, and 45 min as described in A. Overlay histograms are displayed. Live untreated cells (Auto) are represented by a gray-filled histogram. Live cells stained with FITC-conjugated anti-TLR4 are depicted by the unfilled histogram with the black line. Live cells treated with LPS and stained with FITC-conjugated anti-TLR4 are depicted by the unfilled histogram with the gray line. The mean channel fluorescence (MCF) for each histogram is indicated for 40,000 acquired cells (80% gated). C, immunoprecipitation of MMP9 and Western blot analysis of biotinylated cell surface of WT and shRNA MMP9 KD BMA cells. Cells were left untreated as medium control. Cells were pelleted and lysed in lysis buffer, and the protein lysates were immunoprecipitated with the indicated amount (μg) of anti-MMP9 antibody for 24 h. Immunocomplexes were isolated using protein G magnetic beads and resolved by SDS-PAGE, and the blot was probed with streptavidin-HRP followed by Western Lightning Chemiluminescence Reagent Plus. The data are a representation of one of three independent experiments showing similar results. Error bars, S.E. D, immunoprecipitation of TLR4 and Western blot analysis of biotinylated cell surface of WT and shRNA MMP9 KD BMA cells. Cells were left untreated as medium control. Cells were pelleted and lysed in lysis buffer, and the protein lysates were immunoprecipitated with anti-TLR4 antibody for 24 h. The same protein lysates were immunoprecipitated with anti-IgG isotype control antibodies. Immunocomplexes were isolated using protein G magnetic beads and resolved by SDS-PAGE, and the blot was probed with streptavidin-HRP followed by Western Lightning Chemiluminescence Reagent Plus. The data are a representation of one of three independent experiments showing similar results.
FIGURE 8.
FIGURE 8.
A, MMP9 siRNA transfection of RAW-Blue macrophage cells. Cells were doubly transfected with three different doses of siRNA MMP9 particles using Lipofectamine 2000. The cells were lysed, the lysates from untreated WT and siRNA MMP9 KD cells were separated by SDS-PAGE, and the blot was probed with anti-MMP9 antibody. β-Actin was used as an internal control protein for loading of the cytoplasmic cell lysate. The data are a representation of one of three independent experiments showing similar results. B, Western blot analysis of LPS-induced phosphorylated NFκB (Ser(P)311) in cytoplasmic cell lysates. WT and siRNA MMP9 KD RAW-Blue macrophage cells were stimulated with 5 μg/ml LPS for 45 min or left untreated as medium control. Cell lysates from the WT and siRNA MMP9 KD cells were separated by SDS-PAGE, and the blot was probed with phospho-specific polyclonal rabbit antibody against NFκBp65 Ser(P)311. β-actin was used as an internal control protein for loading of the cytoplasmic cell lysate. The data are a representation of one of three independent experiments showing similar results. C, LPS-induced sialidase activity in live WT and siRNA MMP9 KD RAW-Blue macrophage cells. After removing medium, 0.2 mm 4-MUNANA substrate in Tris-buffered saline, pH 7.4, was added to cells alone (no ligand control) or with 5 μg/ml LPS. Fluorescent images were taken at 1 min after adding substrate using epifluorescent microscopy (×40 objective). The mean fluorescence surrounding the cells for each of the images was measured using ImageJ software. The data are a representation of one of five independent experiments showing similar results. Error bars, S.E. D, TLR2 ligands LTA and killed M. butyricum (Myco) and TLR4 ligand LPS induced sialidase activity in live primary BM macrophage cells from WT and MMP9 KO mice. Primary BM macrophage cells obtained from normal, WT and MMP9 KO C57Bl/6 and 129 mice were cultured in conditioned medium supplemented with 20% (v/v) M-CSF, 10% FCS, and penicillin/streptomycin/glutamine for 7–8 days on circular glass slides in 24-well tissue culture plates. After removing medium, 0.2 mm 4-MUNANA substrate in Tris-buffered saline, pH 7.4, was added to cells alone (no ligand control) or with 5 μg/ml LPS, 1 μg/ml of LTA, or 10 μg/ml M. butyricum. Fluorescent images were taken at 1 min after adding substrate using epifluorescent microscopy (×40 objective). The mean fluorescence surrounding the cells for each of the images was measured using ImageJ software.
FIGURE 9.
FIGURE 9.
A, MMP9 colocalizes with TLR4. BMA macrophage cells were treated with 5 μg/ml LPS for 5, 15, 30, and 45 min or left untreated as controls. Cells were fixed, non-permeabilized, and immunostained with rat anti-mouse TLR4 (HTS510, Santa Cruz Biotechnology, Inc.) and rabbit anti-mouse MMP9 (H-129, Santa Cruz Biotechnology, Inc.) followed by Alexa Fluor594 goat anti-rabbit IgG or Alexa Fluor488 rabbit anti-rat IgG. Stained cells were visualized using a confocal inverted microscope (Leica TCS SP2 MP inverted confocal microscope) with a ×100 oil objective. Images were captured using a z-stage of 8–10 images/cell at 0.5-mm steps and were processed using ImageJ version 1.38x software. To calculate the amount of colocalization in the selected images, the Pearson correlation coefficient was measured and expressed as a percentage using ImageJ version 1.38x software. B, flow cytometry analysis of MMP9 expressed on the cell surface of live BMA macrophage cells following LPS treatment for 5 min as described in the legend to Fig. 7A. MMP9 co-immunoprecipitates with TLR4 (C), and conversely, TLR4 co-immunoprecipitates with MMP9 (D). BMA macrophage cells are left cultured in medium or in medium containing 5 μg/ml LPS. Cells (1 × 10⁷ cells) are pelleted and lysed in lysis buffer. MMP9 and TLR4 in cell lysates from BMA cells are immunoprecipitated with 1.0 μg of rabbit anti-MMP9 or 2 μg of rat anti-TLR4 antibodies for 24 h. Following immunoprecipitation, complexes are isolated using protein A or G magnetic beads and resolved by 8% gel electrophoresis (SDS-PAGE). The blots are probed for TLR4 (88 kDa) with anti-TLR4 or MMP9 (78 or 84 kDa) with anti-MMP9 antibodies followed by Clean-Blot IP Detection Reagent for immunoprecipitation/Western blots and Western Lightning Chemiluminescence Reagent Plus. The chemiluminescence reaction was analyzed with x-ray film. Sample concentration for gel loading was determined by Bradford assay. Quantitative analysis was done by assessing the density of TLR4 or MMP9 bands corrected for background in each lane using Corel Photo Paint 8.0 software. Each bar in the graphs represents the mean ratio corrected density of TLR4 over the MMP9 band for 6–8 replicate measurements within each lane. The data are a representation of one of five independent experiments showing similar results. IP, immunoprecipitation.
FIGURE 10.
FIGURE 10.
A, MMP9 colocalizes with Neu1. BMA macrophage cells were treated with 5 μg/ml LPS for 5, 15, 30, and 45 min or left untreated as controls. Cells were fixed, non-permeabilized, and immunostained with rabbit anti-Neu1 (H-300, Santa Cruz Biotechnology, Inc.) and goat anti-MMP9 (C-20, Santa Cruz Biotechnology, Inc.) followed by Alexa Fluor568 rabbit anti-goat IgG or Alexa Fluor488 donkey anti-rabbit IgG. Stained cells were visualized using a confocal inverted microscope (Leica TCS SP2 MP inverted confocal microscope) with a ×100 oil objective. Images were captured using a z-stage of 8–10 images/cell at 0.5-mm steps and were processed using ImageJ version 1.38x software. To calculate the amount of colocalization in the selected images, the Pearson correlation coefficient was measured and expressed as a percentage using ImageJ version 1.38x software. The data are a representation of one of three independent experiments showing similar results. MMP9 co-immunoprecipitates with Neu1 (B), and conversely, Neu1 co-immunoprecipitates with MMP9 (C). BMA macrophage cells were left cultured in medium or in medium containing 5 μg/ml LPS for the indicated time intervals. Cells (1 × 10⁷ cells) were pelleted and lysed in lysis buffer. MMP9 and Neu1 in cell lysates from BMA cells were immunoprecipitated with 1.0 μg of goat anti-MMP9 or 1 μg of rabbit anti-Neu1 antibodies for 24 h. Following immunoprecipitation, complexes were isolated using protein A or G magnetic beads, washed 3 times in buffer, and resolved by 8% SDS-PAGE. The blots were probed for MMP9 (78 or 84 kDa) with anti-MMP9 or Neu1 (45.5 kDa) with anti-Neu1 antibodies followed by Clean-Blot IP Detection Reagent for immunoprecipitation/Western blots and Western Lightning Chemiluminescence Reagent Plus. The chemiluminescence reaction was analyzed with x-ray film. Sample concentration for gel loading was determined by Bradford assay. Quantitative analysis was done by assessing the density of Neu1 or MMP9 bands corrected for background in each lane using Corel Photo Paint 8.0 software. Each bar in the graphs represents the mean ratio corrected density of the Neu1 band over the MMP9 band for 6–8 replicate measurements within each lane. The data are a representation of one of three independent experiments showing similar results. Error bars, S.E. IP, immunoprecipitation.

References

    1. Amith S. R., Jayanth P., Franchuk S., Siddiqui S., Seyrantepe V., Gee K., Basta S., Beyaert R., Pshezhetsky A. V., Szewczuk M. R. (2009) Glycoconj. J. 26, 1197–1212 - PubMed
    1. Amith S. R., Jayanth P., Franchuk S., Finlay T., Seyrantepe V., Beyaert R., Pshezhetsky A. V., Szewczuk M. R. (2010) Cell. Signal. 22, 314–324 - PubMed
    1. Jayanth P., Amith S. R., Gee K., Szewczuk M. R. (2010) Cell. Signal. 22, 1193–1205 - PubMed
    1. Kovacsovics-Bankowski M., Rock K. L. (1994) Eur. J. Immunol. 24, 2421–2428 - PubMed
    1. Shen Z., Reznikoff G., Dranoff G., Rock K. L. (1997) J. Immunol. 158, 2723–2730 - PubMed

Publication types

MeSH terms