. 2011 Oct;21(10):1728-37.
doi: 10.1101/gr.119784.110. Epub 2011 Aug 26.

A powerful and flexible statistical framework for testing hypotheses of allele-specific gene expression from RNA-seq data

Affiliations

A powerful and flexible statistical framework for testing hypotheses of allele-specific gene expression from RNA-seq data

Daniel A Skelly et al. Genome Res. 2011 Oct.

Abstract

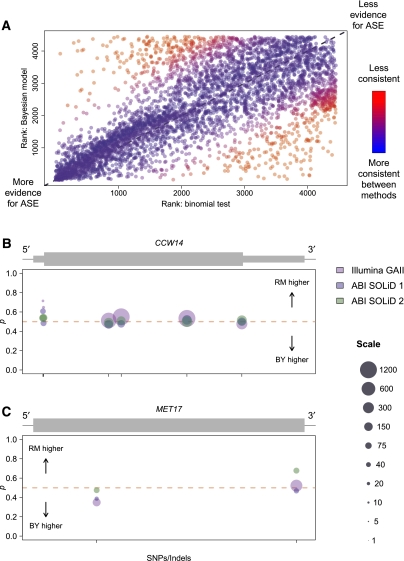
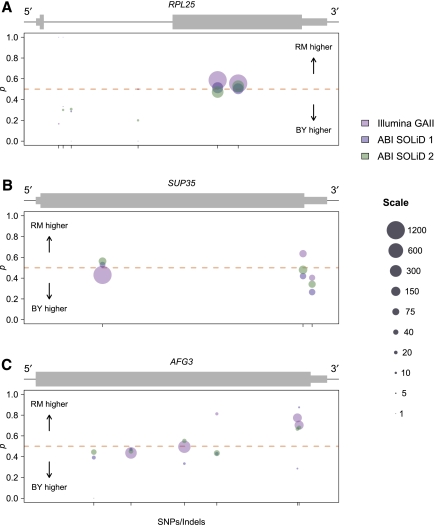
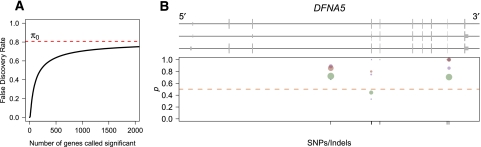
Variation in gene expression is thought to make a significant contribution to phenotypic diversity among individuals within populations. Although high-throughput cDNA sequencing offers a unique opportunity to delineate the genome-wide architecture of regulatory variation, new statistical methods need to be developed to capitalize on the wealth of information contained in RNA-seq data sets. To this end, we developed a powerful and flexible hierarchical Bayesian model that combines information across loci to allow both global and locus-specific inferences about allele-specific expression (ASE). We applied our methodology to a large RNA-seq data set obtained in a diploid hybrid of two diverse Saccharomyces cerevisiae strains, as well as to RNA-seq data from an individual human genome. Our statistical framework accurately quantifies levels of ASE with specified false-discovery rates, achieving high reproducibility between independent sequencing platforms. We pinpoint loci that show unusual and biologically interesting patterns of ASE, including allele-specific alternative splicing and transcription termination sites. Our methodology provides a rigorous, quantitative, and high-resolution tool for profiling ASE across whole genomes.


Figures

Figure 1.
Figure 1.
Schematic outline of our model. (A) The true fraction of reads from allele one should be exactly 0.5 in genomic DNA from a diploid. We use genomic DNA sequencing to calibrate our model in order to account for noise in read counts (arrow depicting width of distribution) at all SNPs as a result of technical variability inherent in the sequencing process. (B) Genes are partitioned into two categories: genes with ASE and those without ASE. For genes without ASE, the distribution of the fraction of reads from allele one is estimated as in A. We borrow information from across all genes to estimate the mean and variability of the corresponding distributions for genes with ASE, the second category. Some genes in this category have a mean different from 0.5 but low dispersion in read counts, like genes without ASE (blue distributions). Other genes in this category have greater dispersion in read counts (tan distributions). (C) Distributions for the fraction of reads from allele one are estimated for each gene. Differences in mean and variability of these gene-specific distributions allow for genes that do not show ASE (top), genes that show ASE that is constant across the transcript (middle), and genes that potentially show complex patterns of ASE (variable ASE), such as allele-specific alternative splicing (bottom). (Left panels) Gene-specific distributions of the fraction of reads from allele one. (Right panels) Simulated allele-specific read counts for a three-exon gene (gray boxes) containing four SNPs (red lines). Dots below the gene model indicate, at each SNP, the fraction of reads matching allele one.
Figure 2.
Figure 2.
Performance of the Bayesian model for ASE. (A) Receiver operating characteristic (ROC) curve showing the performance of our model compared to the binomial exact test. Read counts were tabulated on simulated data with overdispersion, as described in the Supplemental Methods. The ROC curve plots the number of true positives called correctly and the number of false positives called incorrectly using P-value thresholds from 0–1 for the binomial test and posterior probabilities of no ASE from 0–1 for our Bayesian model. (B) Observed FDR closely tracks the true FDR. Observed and true FDRs were calculated for simulated data with overdispersion, as described in the Supplemental Methods. The dotted light gray line shows y = x.
Figure 3.
Figure 3.
Concordance of measurements of ASE obtained using different sequencing platforms. (A) Overlap between genes showing significant ASE at FDR = 5% for two sequencing platforms. (Orange square) Genes called significant in data from both platforms. (Blue squares) Genes called significant on only one platform, indicated on the far side of the square. Numbers in white indicate the number of genes falling into each category; the area of each square is proportional to this number. (B) Magnitude of log2-fold difference in gene expression for genes called significant at FDR = 5%. Log2-fold differences are computed with respect to the allele with lower expression, causing all values to be positive. Lines shown are continuous approximations to discrete densities. (Blue line) Density for genes called significant using only one sequencing platform. (Orange line) Density for genes called significant in data from both sequencing platforms.
Figure 4.
Figure 4.
Global features of ASE in the yeast genome. (A) Posterior distribution of the fraction of genes showing ASE, 1 − π0. (B) Posterior distribution for the size of the fold-change in expression of genes showing ASE. Fold-change values are shown relative to the allele expressed at a lower level, meaning that all values are greater than one. Distribution depicts the estimated probability density from which the magnitude of the ASE would be drawn for a new gene known to show ASE. Distribution shown was simulated by randomly drawing values from beta distributions specified by posterior samples of f and g, which determine the shape of the probability density of the binomial parameter p for genes showing ASE.
Figure 5.
Figure 5.
Comparison of results from the binomial test and Bayesian model of ASE. (A) Plot comparing ranks of genes in terms of evidence for ASE for the binomial test versus the Bayesian model. Ranks were determined using P-values for the binomial test and using posterior probabilities of ASE for the Bayesian model. Ties were broken by random assignment of ranks to genes with equal P-values/posterior probabilities of ASE. Points are colored according to consistency of ranks between methods. As shown in the color bar to the right, redder points represent genes with ranks that are less consistent between methods, while bluer points show genes ranked more consistently between methods. Dotted gray line in background follows y = x. (B) Allele-specific read counts for the gene CCW14, which is called as showing ASE using the binomial test, but not with the Bayesian model. Plot depicts the gene model (gray rectangles), with thick rectangles representing exons, thinner rectangles representing 5′ and 3′ UTRs, and the thin black line representing intergenic sequence. Circles plotted below the gene model show allele-specific read count data organized by SNPs/indels within the gene. Circles are centered on the point p = (BY count)/(BY count + RM count), and sized according to the total number of reads contributing to the observation. Scaling of circle size follows the scale given on the far right, with all observations with more than 1200 reads set to the largest size shown (1200). Circle colors indicate which experiment the observation is derived from, as shown in the legend on the far right. Ticks on the x-axis indicate the location of SNPs or indels used to distinguish between alleles. Sequence coverage is high, and the slight departures from 50:50 allelic expression are likely due to technical variability rather than some underlying biological mechanism. (C) Allele-specific read counts for the gene MET17, which is called as showing ASE using the Bayesian model, but not with the binomial test. Plot is organized and colored identically to B. The data show a modest but reproducible change in ASE from read counts higher for the BY allele to read counts higher for the RM allele moving 5′ to 3′.
Figure 6.
Figure 6.
Examples of genes showing variable ASE. Plots are organized and colored identically to Figure 5, B and C. (A) Allele-specific read counts for the gene RPL25. Thin black line represents both intronic and intergenic sequence. Read counts indicate reproducibly equal expression in exon two of the gene, but expression biased in favor of the BY allele at four SNPs within the intron, consistent with allele-specific differences in splicing. (B) Allele-specific read counts for the gene SUP35. Higher expression of the BY allele at a SNP in the 3′ UTR suggests allele-specific variation in UTR length. (C) Allele-specific read counts for the gene AFG3. Higher expression of the RM allele near the 3′ end of the gene is consistent with allele-specific variation in transcript structure that could occur some distance away from the SNP tagging the ASE.
Figure 7.
Figure 7.
ASE in the human genome. (A) Plot of the false-discovery rate as a function of the number of genes called significant. Since the human RNA-seq data set is low coverage for most genes, it is not possible to identify many genes showing significant ASE without risking a relatively large proportion of false discoveries. (B) Human gene DFNA5, which shows significant ASE in individual NA18498. Plot is organized identically to Figure 5, B and C, with different colored dots representing measurements obtained from separate Illumina sequencing lanes. Although the number of reads is low for any given dot, the proportion of reads from allele one is consistently higher than that for allele two.

References

    1. Blanchette M, Kent WJ, Riemer C, Elnitski L, Smit AF, Roskin KM, Baertsch R, Rosenbloom K, Clawson H, Green ED, et al. 2004. Aligning multiple genomic sequences with the threaded blockset aligner. Genome Res 14: 708–715 - PMC - PubMed
    1. Bray NJ, Buckland PR, Owen MJ, O'Donovan MC 2003. Cis-acting variation in the expression of a high proportion of genes in human brain. Hum Genet 113: 149–153 - PubMed
    1. Brem RB, Yvert G, Clinton R, Kruglyak L 2002. Genetic dissection of transcriptional regulation in budding yeast. Science 436: 701–703 - PubMed
    1. Britten RJ, Davidson EH 1971. Repetitive and non-repetitive DNA sequences and a speculation on the origins of evolutionary novelty. Q Rev Biol 46: 111–138 - PubMed
    1. Bullard JH, Purdom EA, Hansen KD, Dudoit S 2010. Evaluation of statistical methods for normalization and differential expression in mRNA-Seq experiments. BMC Bioinformatics 11: 94 doi: 10.1186/1471-2105-11-94 - PMC - PubMed

Publication types

Substances

LinkOut - more resources