. 2011 Nov;301(5):H1788-97.
doi: 10.1152/ajpheart.00599.2011. Epub 2011 Aug 26.

Temporal and spatial correlation of platelet-activating factor-induced increases in endothelial [Ca²⁺]i, nitric oxide, and gap formation in intact venules

Affiliations

Temporal and spatial correlation of platelet-activating factor-induced increases in endothelial [Ca²⁺]i, nitric oxide, and gap formation in intact venules

Xueping Zhou et al. Am J Physiol Heart Circ Physiol. 2011 Nov.

Abstract

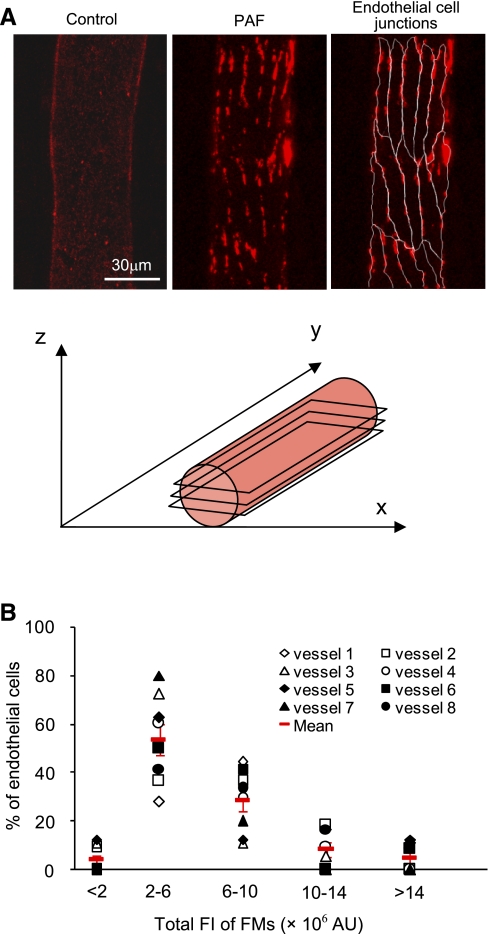
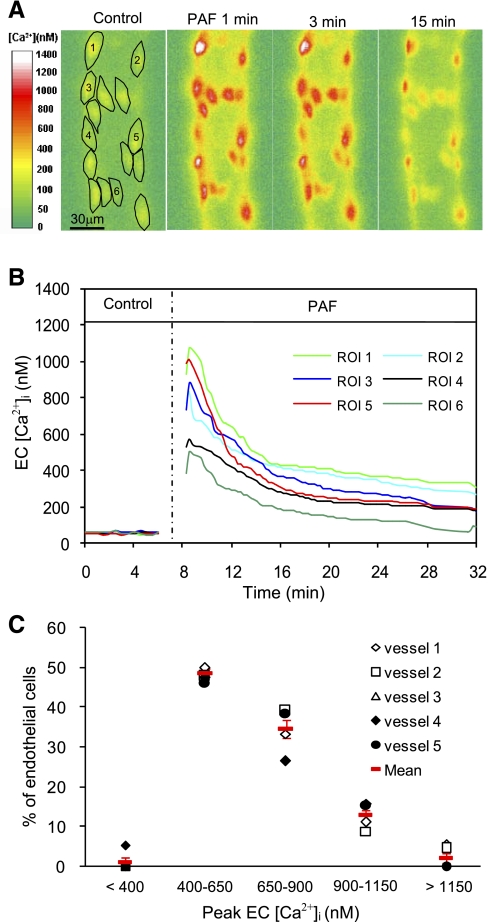
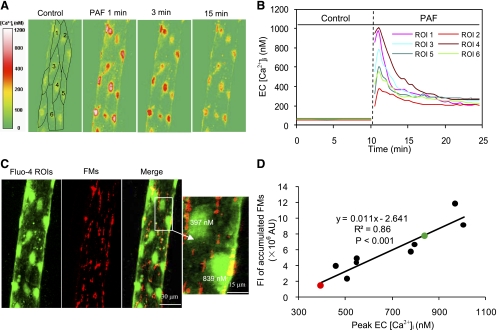
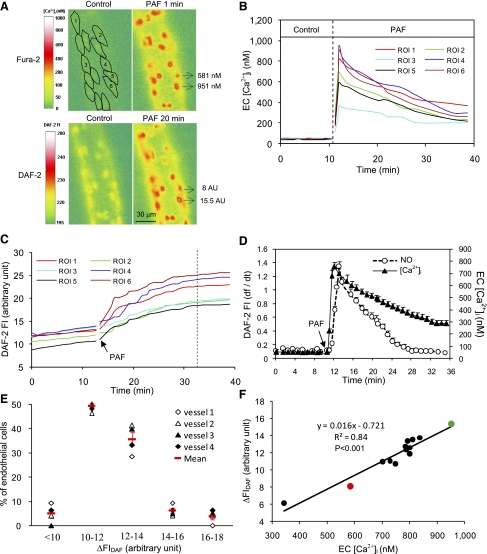
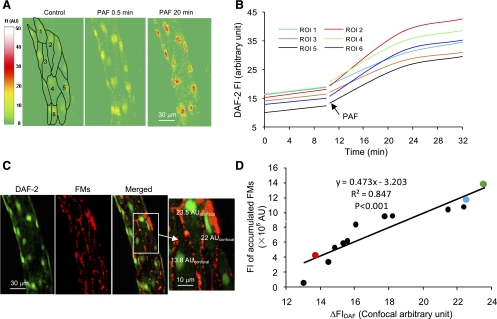
We have previously demonstrated that platelet-activating factor (PAF)-induced increases in microvessel permeability were associated with endothelial gap formation and that the magnitude of peak endothelial intracellular Ca(2+) concentration ([Ca(2+)](i)) and nitric oxide (NO) production at the single vessel level determines the degree of the permeability increase. This study aimed to examine whether the magnitudes of PAF-induced peak endothelial [Ca(2+)](i), NO production, and gap formation are correlated at the individual endothelial cell level in intact rat mesenteric venules. Endothelial gaps were quantified by the accumulation of fluorescent microspheres at endothelial clefts using confocal imaging. Endothelial [Ca(2+)](i) was measured on fura-2- or fluo-4-loaded vessels, and 4,5-diaminofluorescein (DAF-2) was used for NO measurements. The results showed that increases in endothelial [Ca(2+)](i), NO production, and gap formation occurred in all endothelial cells when vessels were exposed to PAF but manifested a spatial heterogeneity in magnitudes among cells in each vessel. PAF-induced peak endothelial [Ca(2+)](i) preceded the peak NO production by 0.6 min at the cellular level, and the magnitudes of NO production and gap formation linearly correlated with that of the peak endothelial [Ca(2+)](i) in each cell, suggesting that the initial levels of endothelial [Ca(2+)](i) determine downstream NO production and gap formation. These results provide direct evidence from intact venules that inflammatory mediator-induced increases in microvessel permeability are associated with the generalized formation of endothelial gaps around all endothelial cells. The spatial differences in the molecular signaling that were initiated by the heterogeneous endothelial Ca(2+) response contribute to the heterogeneity in permeability increases along the microvessel wall during inflammation.


Figures

Fig. 1.
Fig. 1.
Platelet-activating factor (PAF)-induced endothelial gap formation. A, top: confocal images of fluorescent microspheres (FMs) from two representative experiments that were perfused with albumin-Ringer solution (left) and after an exposure to PAF (10 nM; middle and right), respectively. The right image shows the outline of endothelial junctions based on the profile of the accumulated FMs. Bottom, diagram showing the z-stack of confocal images in relation to vessel orientation. B: histograms showing the magnitude distribution of the accumulated FMs around each endothelial cell (EC) in 103 cells of 8 vessels. Red symbols show means ± SE of eight vessels. FI, fluorescence intensity; AU, arbitrary units.
Fig. 2.
Fig. 2.
Variation of endothelial intracellular Ca2+ concentration ([Ca2+]i) responses to PAF among ECs of one vessel. A: fura-2 ratio images from one representative experiment showing the changes in endothelial [Ca2+]i at 1, 3, and 15 min after the start of PAF application in 15 regions of interest (ROIs). B: time course of PAF-induced changes in endothelial [Ca2+]i in 6 of the 15 ROIs. C: histogram showing the distribution of PAF-induced peak endothelial [Ca2+]i in 88 ECs of 5 vessels. Red symbols show means ± SE.
Fig. 3.
Fig. 3.
Correlation of PAF-induced peak endothelial [Ca2+]i with the magnitude of endothelial gap formation at the cellular level. A: fluo-4 confocal images from one representative experiment before and after the start of PAF perfusion at 1, 3, and 15 min. Each confocal image is the projection of 5 consecutive sections from the bottom half of the vessel. B: time course of PAF-induced changes in endothelial [Ca2+]i in 6 of 10 ROIs from the image in A. C: confocal images of fluo-4 (green) and FMs (red) projected from the bottom half of one vessel. The magnified image shows two ECs. The cell with a higher peak endothelial [Ca2+]i (839 nM) was surrounded by more entrapped FMs (7.7 × 10⁶ AU), and less FM accumulation (1.4 × 10⁶ AU) occurred around the cell with a lower peak endothelial [Ca2+]i (397 nM). D: linear correlation between peak endothelial [Ca2+]i and the magnitude of FM accumulation around each EC from the image in A. The green and red circles represent the two ECs in C.
Fig. 4.
Fig. 4.
Correlation between PAF-induced nitric oxide (NO) production and peak endothelial [Ca2+]i at the cellular level. A: fura-2 and 4,5-diaminofluorescein (DAF-2) fluorescence images from one representative experiment before and after PAF stimulation. The two ECs indicated by arrows have different responses. The cell with a higher NO response [net increase in DAF-2 FI (ΔFIDAF) = 15.5 AU] has a higher peak endothelial [Ca2+]i (951 nM), and the cell with a lower NO response (ΔFIDAF = 8 AU) has a lower peak endothelial [Ca2+]i (581 nM). B and C: time course of PAF-induced changes in endothelial [Ca2+]i and NO production in 6 of 14 ROIs. Time 0 in C indicates the time when the DAF-2 loading reached steady state. The vertical dotted line indicates the time when the PAF-induced NO production rate declined to baseline levels. D: temporal relationship between PAF-induced changes in endothelial [Ca2+]i and NO production grouped from all ECs of the vessel in A. E: histogram showing the magnitude distribution of PAF-induced NO production in 44 endothelial cells of 4 vessels. F: linear correlation between PAF-induced peak endothelial [Ca2+]i and the amount of NO production in 14 ECs from the image in A. The green and red circles represent the two ECs that are in A.
Fig. 5.
Fig. 5.
Spatial correlation between PAF-induced NO production and endothelial gap formation. A: DAF-2 confocal images from one representative experiment showing changes in FIDAF at the cellular level before and after the start of PAF perfusion at 0.5 and 20 min. Each image represents the projection of five consecutive sections from the bottom half of the vessel. B: time-dependent DAF-2 cumulative FI curve in 6 of 13 ECs. Images were collected for 20 min at 10-min intervals. C: confocal images of DAF-2 (green) and FMs (red) projected from the lower half of the same vessel in A. The three ECs in the magnified image illustrate that the cell had higher FM accumulation correlated with a larger magnitude of NO production, where ΔFIDAF was measured in confocal AU (AUconfocal). D: linear relationship between the magnitude of NO production and endothelial gap formation of 13 ECs of the representative vessel. The red, blue, and green circles represent the three ECs in the magnified image in C.

Similar articles

Cited by

References

    1. Adamson RH, Zeng M, Adamson GN, Lenz JF, Curry FE. PAF- and bradykinin-induced hyperpermeability of rat venules is independent of actin-myosin contraction. Am J Physiol Heart Circ Physiol 285: H406–H417, 2003 - PubMed
    1. Baldwin AL. Modified hemoglobins produce venular interendothelial gaps and albumin leakage in the rat mesentery. Am J Physiol Heart Circ Physiol 277: H650–H659, 1999 - PubMed
    1. Braverman IM, Keh-Yen A. Three-dimensional reconstruction of endothelial cell gaps in psoriatic vessels and their morphologic identity with gaps produced by the intradermal injection of histamine. J Invest Dermatol 86: 577–581, 1986 - PubMed
    1. Bucci M, Gratton JP, Rudic RD, Acevedo L, Roviezzo F, Cirino G, Sessa WC. In vivo delivery of the caveolin-1 scaffolding domain inhibits nitric oxide synthesis and reduces inflammation. Nat Med 6: 1362–1367, 2000 - PubMed
    1. Bucci M, Roviezzo F, Posadas I, Yu J, Parente L, Sessa WC, Ignarro LJ, Cirino G. Endothelial nitric oxide synthase activation is critical for vascular leakage during acute inflammation in vivo. Proc Natl Acad Sci USA 102: 904–908, 2005 - PMC - PubMed

Publication types

LinkOut - more resources