. 2011 Oct 1;187(7):3694-703.
doi: 10.4049/jimmunol.1101872. Epub 2011 Aug 26.

Mutagenesis of beryllium-specific TCRs suggests an unusual binding topology for antigen recognition

Affiliations

Mutagenesis of beryllium-specific TCRs suggests an unusual binding topology for antigen recognition

Natalie A Bowerman et al. J Immunol. .

Abstract

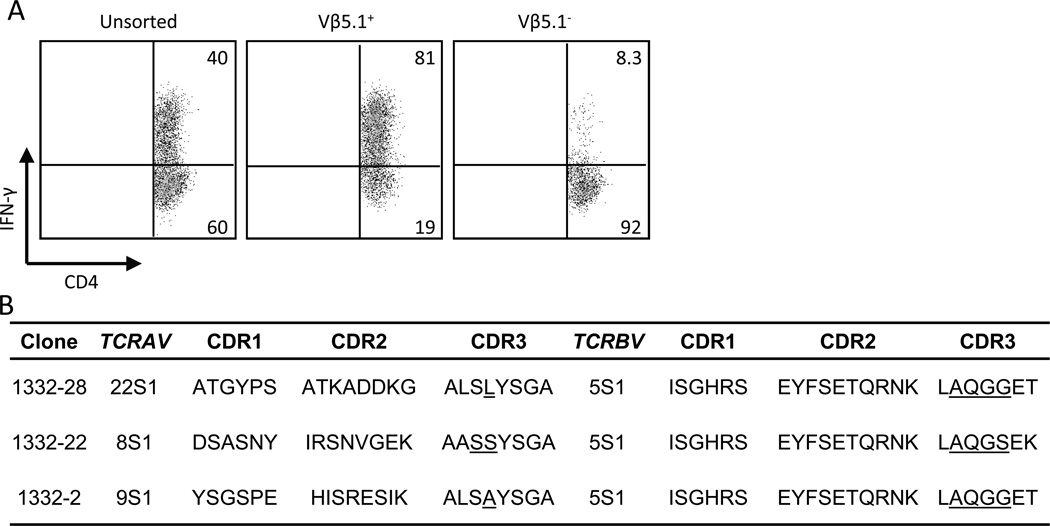
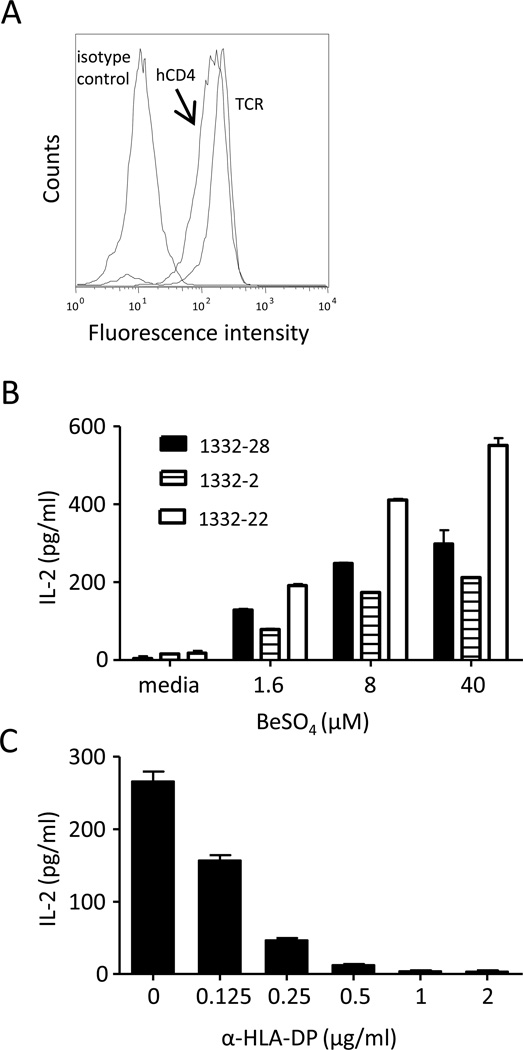
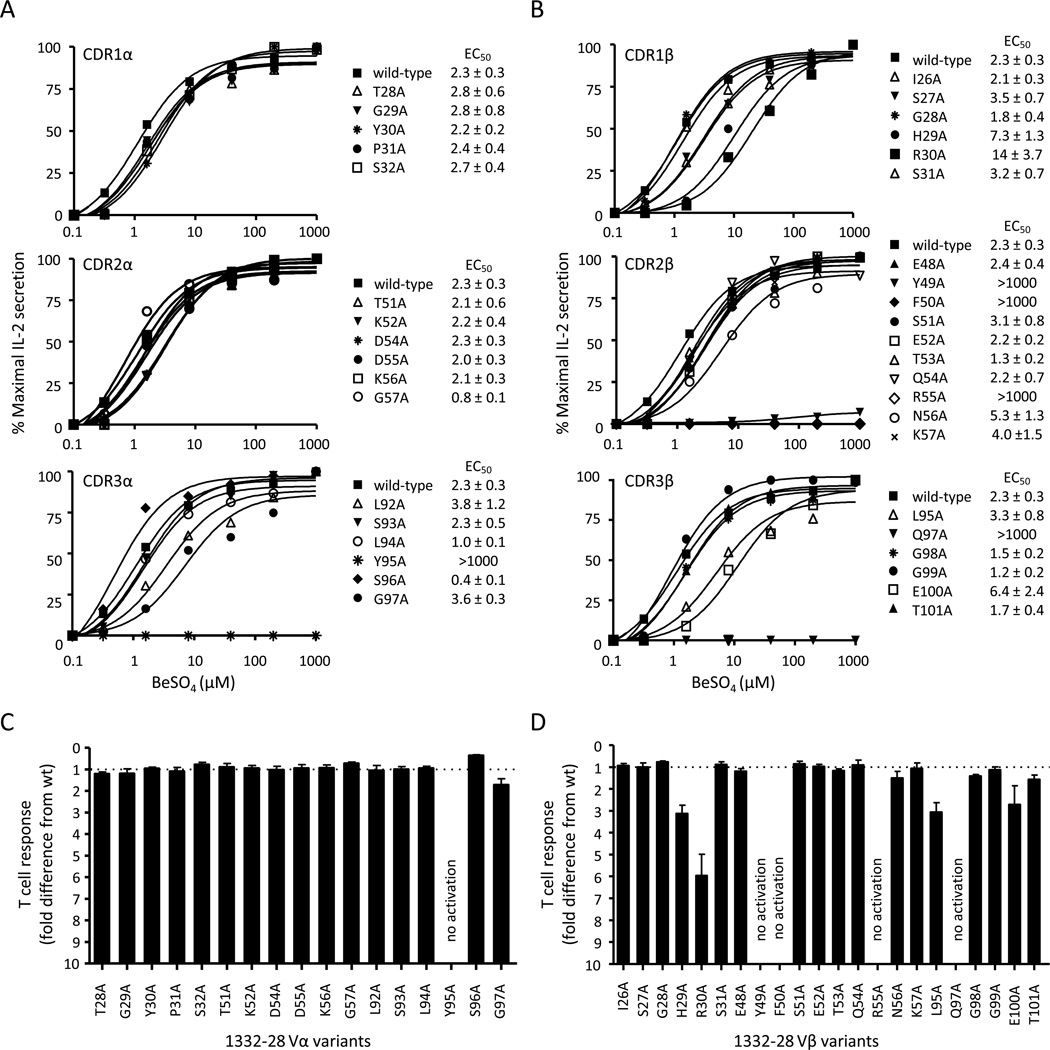
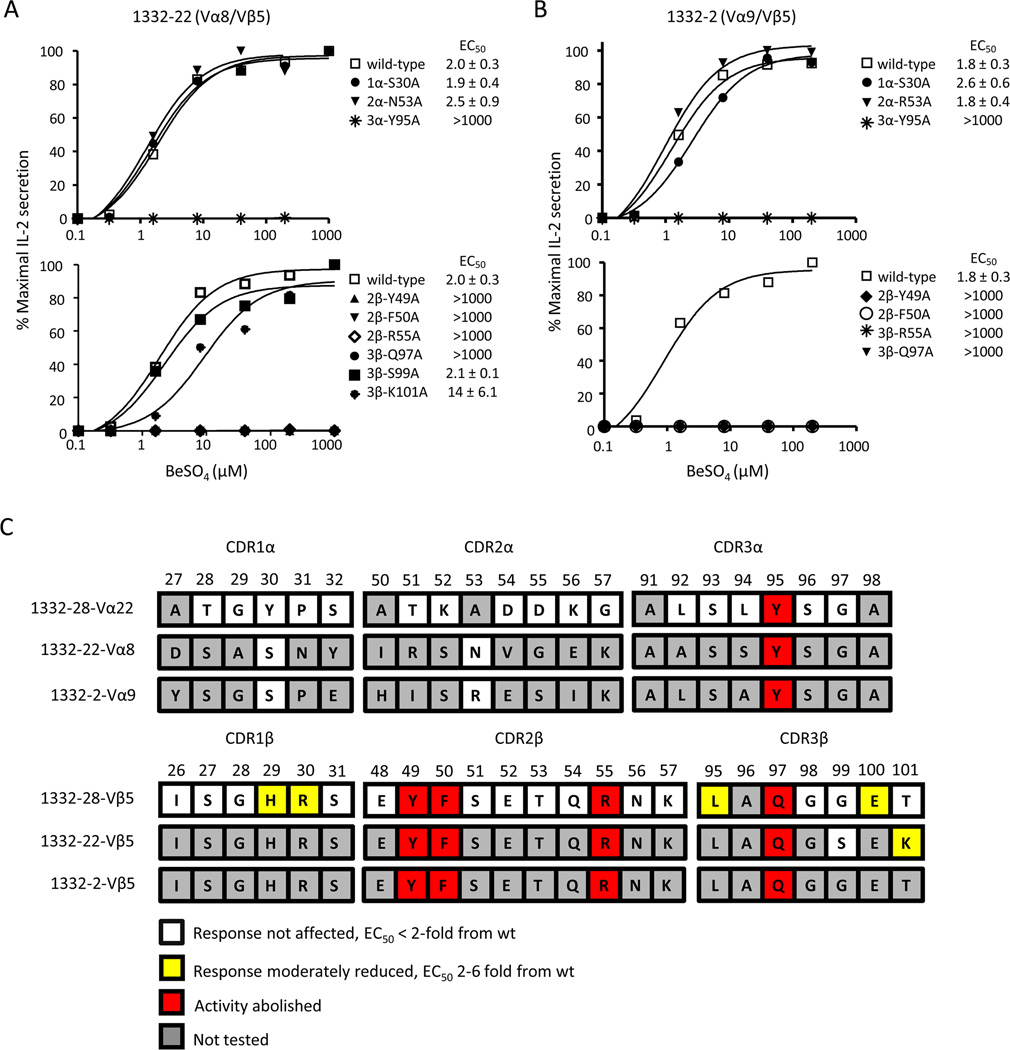
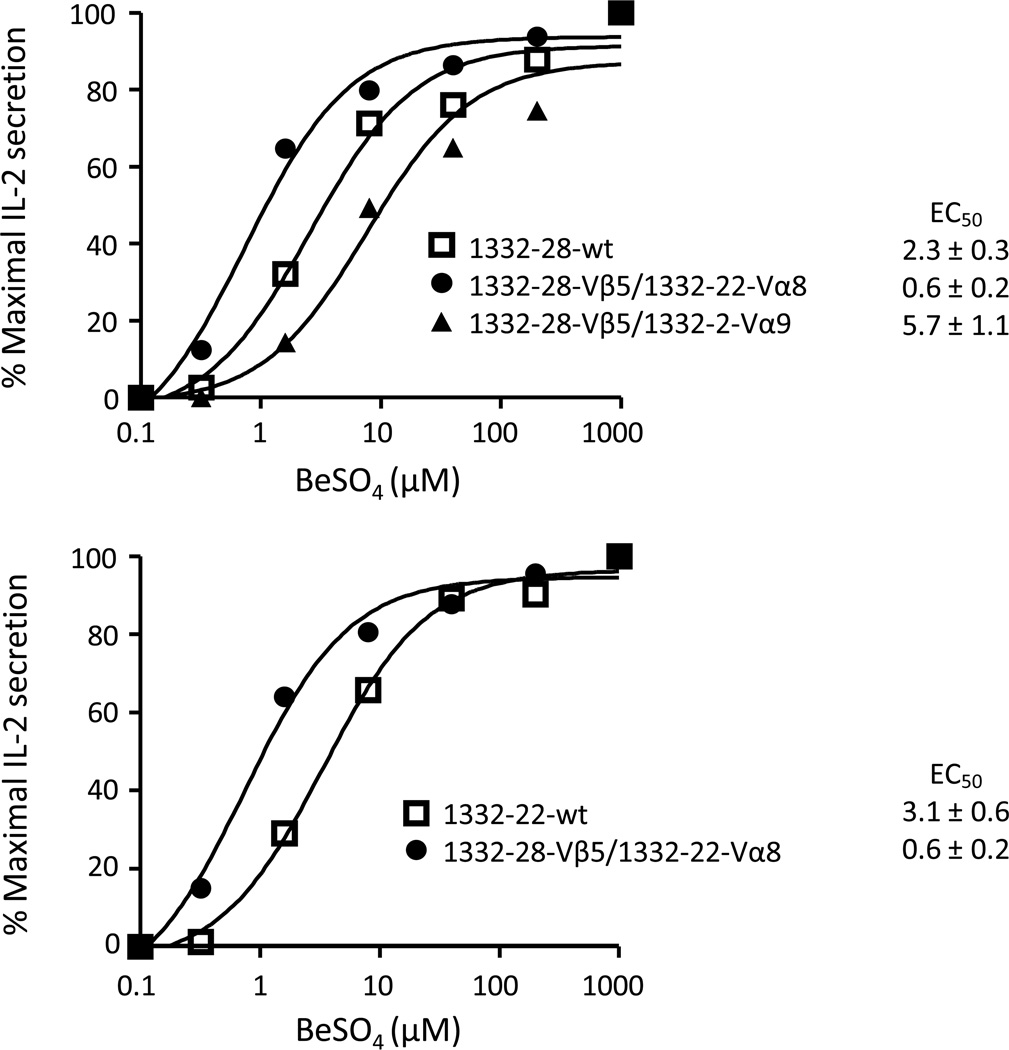
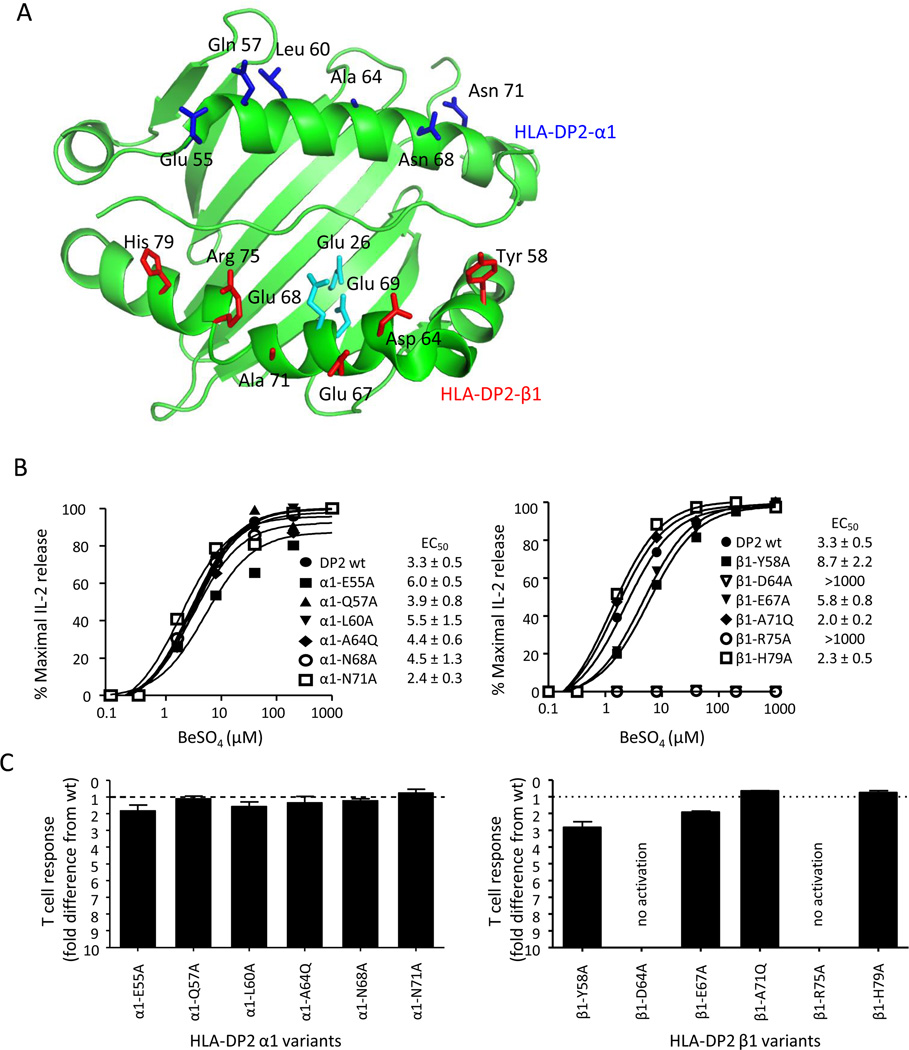
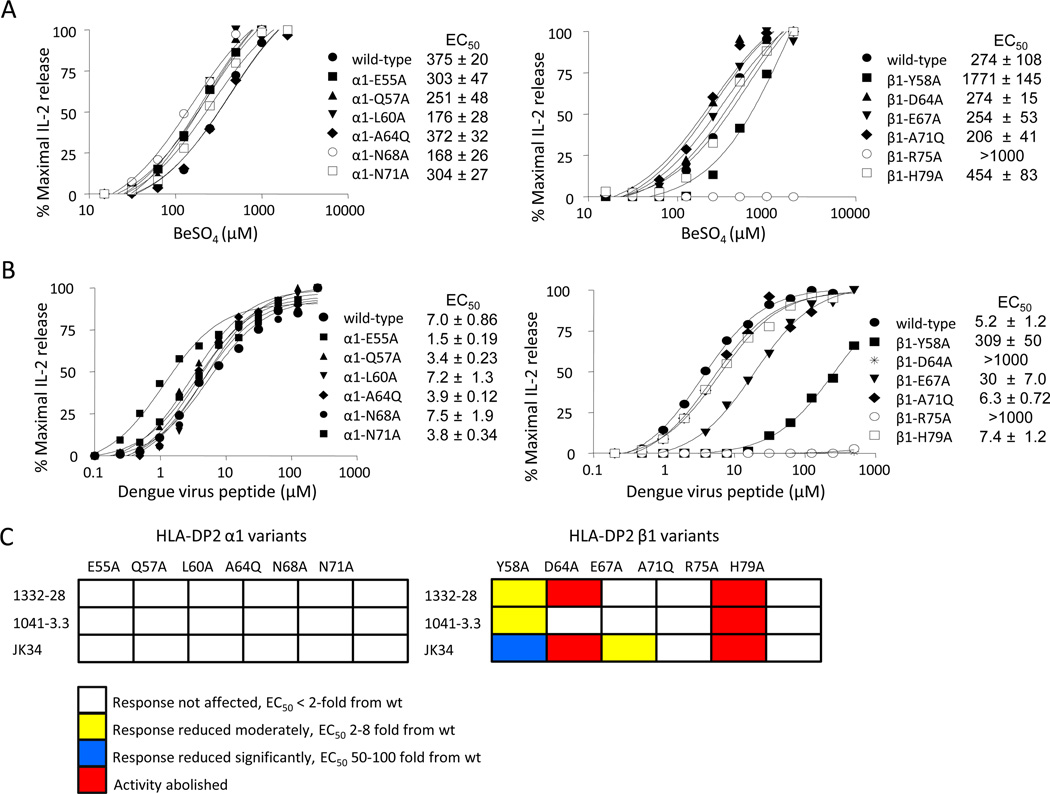
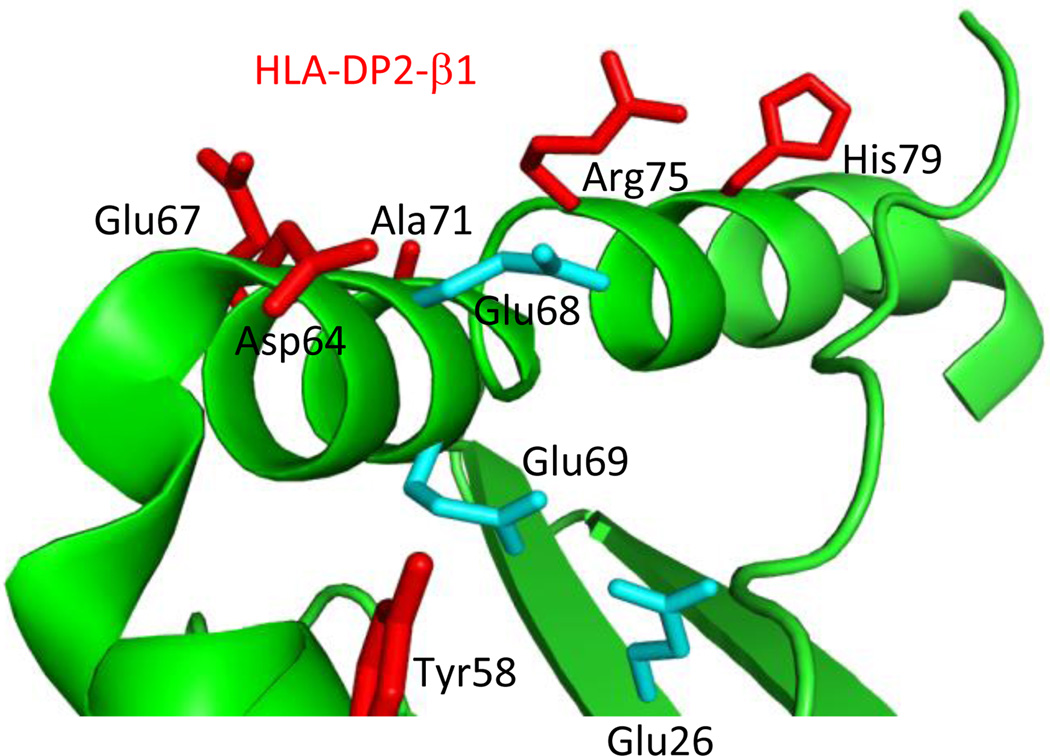
Unconventional Ags, such as metals, stimulate T cells in a very specific manner. To delineate the binding landscape for metal-specific T cell recognition, alanine screens were performed on a set of Be-specific TCRs derived from the lung of a chronic beryllium disease patient. These TCRs are HLA-DP2-restricted and express nearly identical TCR Vβ5.1 chains coupled with different TCR α-chains. Site-specific mutagenesis of all amino acids comprising the CDRs of the TCRA and TCRB genes showed a dominant role for Vβ5.1 residues in Be recognition, with little contribution from the TCR α-chain. Solvent-exposed residues along the α-helices of the HLA-DP2 α- and β-chains were also mutated to alanine. Two β-chain residues, located near the proposed Be binding site of HLA-DP2, played a dominant role in T cell recognition with no contribution from the HLA-DP2 α-chain. These findings suggest that Be-specific T cells recognize Ag using an unconventional binding topology, with the majority of interactions contributed by TCR Vβ5.1 residues and the HLA-DP2 β1-chain. Thus, unusual docking topologies are not exclusively used by autoreactive T cells, but also for the recognition of unconventional metal Ags, such as Be.


Figures

FIGURE 1
FIGURE 1
Deduced amino acid sequences of a set of Be-responsive, Vβ5.1+CD4+ T cells. A, Intracellular IFN-γ staining of a Be-responsive T cell line derived from the BAL of a CBD patient is shown. The cells were stimulated with either medium alone or BeSO4 and subsequently stained for CD4, Vβ5.1 and intracellular IFN-γ expression. The number in the upper right quadrant of each density plot indicates the percentage of CD4+ T cells expressing IFN-γ. B, Analysis of deduced TCRA and TCRB CDR1, CDR2 and CDR3 amino acid sequences expressed by the Be-responsive T cell clones derived from the T cell line in A. Underlined amino acids indicate those encoded by non-germline nucleotides. These sequence data are available from GenBank under accession numbers JF834314 - JF834319 http://www.ncbi.nlm.nih.gov/genbank/.
FIGURE 2
FIGURE 2
Characterization of Be-specific T cell hybridomas. A, Expression of TCR and human CD4 on the 1332-28 T cell hybridoma. Constructs encoding the variable domain of the TCR α- and β-chains of Be-specific T cell clones were transduced into the TCR murine T cell hybridoma, 5KC. The resultant T cell hybridomas were stained with anti-human CD4 and anti-TCR mAbs and analyzed on a FACSCaliber flow cytometer. B, Stimulation of T cell hybridomas, designated 1332-28, -22, and -2, with varying BeSO4 concentrations presented by HLA-DP2-transfected murine fibroblasts. The mean ± SEM IL-2 (pg/ml) is shown, and data are representative of three independent experiments. C, Inhibition of Be-induced IL-2 secretion by the addition of various concentrations of the anti-DP mAb, B7.21, is shown.
FIGURE 3
FIGURE 3
Contact sites of the Be-responsive TCR, 1332-28, with the HLA-DP2/peptide/Be complex. Be-specific response of T cell hybridoma 1332-28 expressing wild-type TCR and TCR variants with single-site alanine mutations at each amino acid position of the CDR1 (upper panel), CDR2 (middle panel) and CDR3 (lower panel) of Vα22 (A) and Vβ5.1 (B). TCRs were expressed on 5KC and stimulated with various concentrations of BeSO4 presented by HLA-DP2-transfected murine fibroblasts. IL-2 secretion was measured by ELISA and plotted as % maximal IL-2 secretion against BeSO4 concentration. Activation curves are representative of three independent experiments, and EC50 values (the concentration of BeSO4 required for a half-maximal T cell hybridoma response) were determined by non-linear regression of the activation curves using Graph Pad Prism software. The mean ± SEM EC50 values for the wild-type TCR and each of the variants are shown. The overall EC50 fold-change difference (mean ± SEM) for the TCR α-chain (C) and β-chain (D) variants compared to the wild-type TCR is shown. The dotted line at y = 1 represents the wild-type TCR response.
FIGURE 4
FIGURE 4
Vβ5+ TCRs recognize the HLA-DP2/peptide/Be complex using identical contact sites. A and B Stimulation of Be-specific T cell hybridomas, 1332-22 and -2, expressing selected mutations in the CDRs of the TCR α- and TCR β-chains with HLA-DP2-expressing DAP.3 fibroblasts and various concentration of BeSO4. T cell secretion of IL-2 was measured by ELISA and plotted as described in Figure 3. Activation curves are representative of three independent experiments. The mean ± SEM EC50 values for the wild-type TCR and each of the variants are shown. C, A color-coded summary of T cell activation data for the stimulation of T cell hybridomas 1332-28, -22, and -2. TCR CDR amino acid sequences for each of the three T cell hybridomas are aligned with the amino acid sequence number shown above. Residues are highlighted based on their effect when mutated to alanine, in comparison to the wild-type response. Residues highlighted in white indicate that an alanine mutation had no effect on T cell response, with EC50 values identical to the wild-type response. Residues highlighted in yellow indicate a mutation that had a moderate effect on T cell hybridoma response, 2–6-fold reduction in response compared to wild-type. Residues highlighted in red indicate the absence of a hybridoma response when mutated to alanine.
FIGURE 5
FIGURE 5
Activation of Be-responsive, Vβ5.1+ TCRs is independent of CDR1α and CDR2α. Stimulation of Be-specific T cell hybridomas expressing noncognate TCRAV genes. The native TCRA gene of the 1332-28 TCR was switched to non-cognate 1332-22 TCRAV8 or 1332-2 TCRAV9 genes, and the resultant hybridomas were stimulated as in Figure 3. Data are plotted as % maximal IL-2 secretion against concentration of beryllium and are representative of three independent experiments. The mean ± SEM EC50 values for the wild-type TCR and the variants are shown.
FIGURE 6
FIGURE 6
Identification of HLA-DP2 contacts for Be-specific, Vβ5.1+ T cells. A, Crystal structure of HLA-DP2 with a self-derived HLA-DRα peptide (PBD ID code 3LQZ). The α1- and β1-domains of HLA-DP2, along with the peptide, are shown in green. Solvent-exposed, upward-facing residues of the HLA-DP2 α1 and β1 α-helices subjected to mutagenesis are shown in blue and red, respectively. Cyan residues denote three glutamic acids proposed to contribute to Be binding. B, HLA-DP2 molecules with single-site mutations introduced along both α-helices were expressed on the surface of murine fibroblasts and used to stimulate 1332-28 TCR. Representative activation curves for the α-chain (left panel) and β-chain (right panel) variants are plotted as % maximal IL-2 release against BeSO4 concentration. Data are representative of at least three separate experiments. C, Shown is EC50 fold-change differences (mean ± SEM) for hybridoma 1332-28 induced by the HLA-DP2 variants compared to wild-type HLA-DP2 for three separate experiments. The dotted line at y = 1 represents the wild-type TCR response.
FIGURE 7
FIGURE 7
Effect of HLA-DP2 variants on the response of other DP2-restricted TCRs. A, Stimulation of a T cell hybridoma expressing a Be-specific, Vα1/Vβ3+ TCR derived from the lung of CBD patient 1041 with HLA-DP2 variants. The T cell hybridoma, designated 1041-3.3, was stimulated with fibroblasts expressing wild-type and α-chain (left panel) and β-chain (right panel) variants of HLA-DP2 and varying BeSO4 concentrations. Activation curves and EC50 values are representative of three independent experiments. B, Stimulation of cells expressing a dengue virus specific Vα11/Vβ23 TCR, designated JK34, with fibroblasts expressing HLA-DP2 α-chain (left panel) and β-chain (right panel) variants and presenting a dengue virus peptide. Representative activation curves from three independent experiments are plotted and used to determine EC50 values. C, A color-coded summary shows the effects of HLA-DP2 variants on various DP2-restricted T cell hybridomas, expressing beryllium-specific TCRs 1332-28 and 1041-3.3 and a dengue-virus-specific JK34 TCR. Residues are colored based upon their effect when mutated to alanine, in comparison to the wild-type response. Residues highlighted in white indicate that an alanine mutation had no effect on T cell hybridoma response, with EC50 values identical to the wild-type response. Residues highlighted in yellow and blue indicate a mutation that either had a moderate (2–8 fold) or large (50–100-fold reduction) effect on the hybridoma response. Residues highlighted in red abolished the IL-2 response when mutated to alanine.
FIGURE 8
FIGURE 8
Structural features of the HLA-DP2 β-chain highlighting the putative Be-binding pocket. Crystal structure of HLA-DP2 with a self-derived HLA-DR α-chain peptide as depicted with PyMol software (PDB ID code, 3LQZ). A cartoon representation of the DR α-chain peptide and the β-chain of HLA-DP2 are shown in green. HLA-DP2 β1 helix residues, subjected to single-site mutagenesis in the current study, are highlighted red. The three glutamic acid residues that make up the putative Be-binding site are highlighted in cyan.

References

    1. Davis MM, Bjorkman PJ. T-cell antigen receptor genes and T-cell recognition. Nature. 1988;334:395–402. - PubMed
    1. Lu L, Vollmer J, Moulon C, Weltzien HU, Marrack P, Kappler J. Components of the ligand for a Ni++ reactive human T cell clone. J. Exp. Med. 2003;197:567–574. - PMC - PubMed
    1. Falta MT, Bowerman NA, Dai S, Kappler JW, Fontenot AP. Linking genetic susceptibility and T cell activation in beryllium-induced disease. Proc. Am Thorac Soc. 2010;7:126–129. - PMC - PubMed
    1. Fontenot AP, Maier LA. Genetic susceptibility and immune-mediated destruction in beryllium-induced disease. Trends Immunol. 2005;26:543–549. - PubMed
    1. Fontenot AP, Canavera SJ, Gharavi L, Newman LS, Kotzin BL. Target organ localization of memory CD4+ T cells in patients with chronic beryllium disease. J. Clin. Invest. 2002;110:1473–1482. - PMC - PubMed

Publication types

MeSH terms