

Skeletal muscle triglycerides, diacylglycerols, and ceramides in insulin resistance: another paradox in endurance-trained athletes?
- PMID: 21873552
- PMCID: PMC3178290
- DOI: 10.2337/db10-1221
Skeletal muscle triglycerides, diacylglycerols, and ceramides in insulin resistance: another paradox in endurance-trained athletes?
Abstract
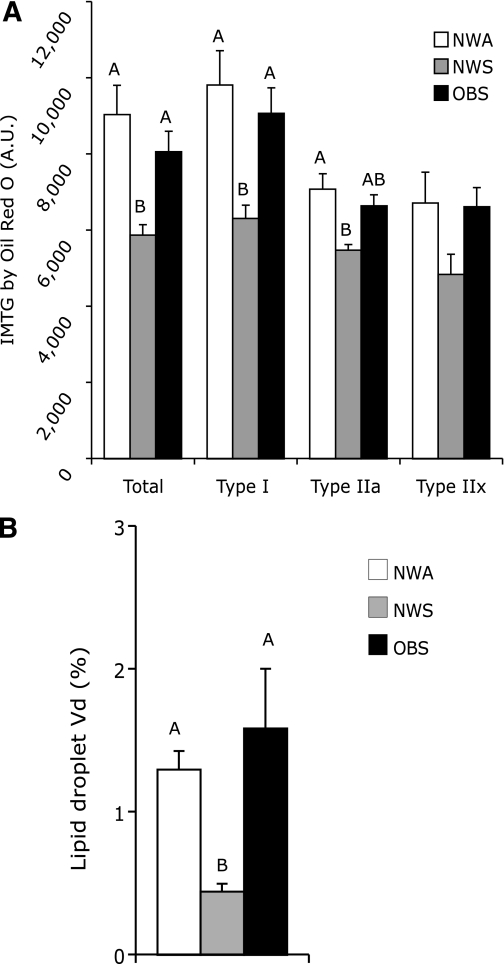
Objective: Chronic exercise and obesity both increase intramyocellular triglycerides (IMTGs) despite having opposing effects on insulin sensitivity. We hypothesized that chronically exercise-trained muscle would be characterized by lower skeletal muscle diacylglycerols (DAGs) and ceramides despite higher IMTGs and would account for its higher insulin sensitivity. We also hypothesized that the expression of key skeletal muscle proteins involved in lipid droplet hydrolysis, DAG formation, and fatty-acid partitioning and oxidation would be associated with the lipotoxic phenotype.
Research design and methods: A total of 14 normal-weight, endurance-trained athletes (NWA group) and 7 normal-weight sedentary (NWS group) and 21 obese sedentary (OBS group) volunteers were studied. Insulin sensitivity was assessed by glucose clamps. IMTGs, DAGs, ceramides, and protein expression were measured in muscle biopsies.
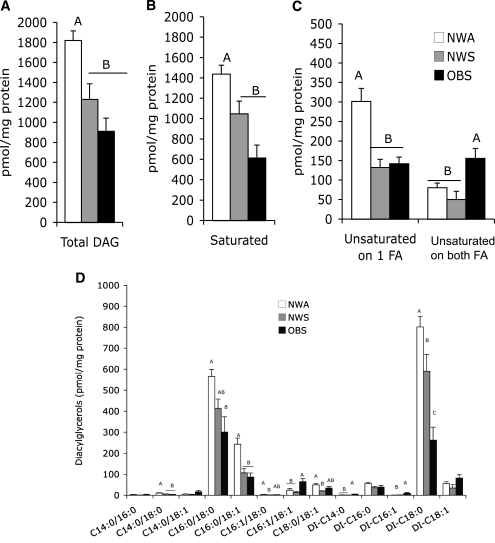
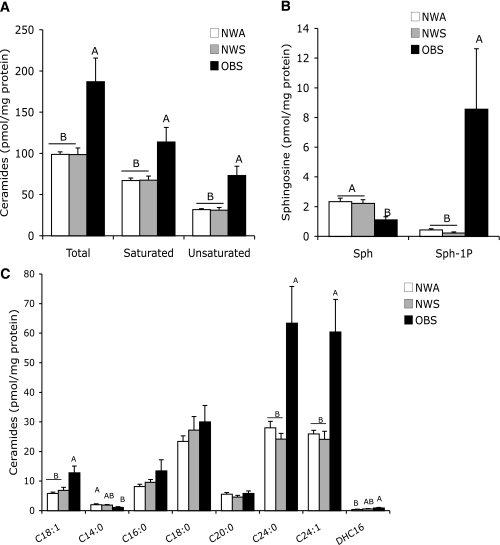
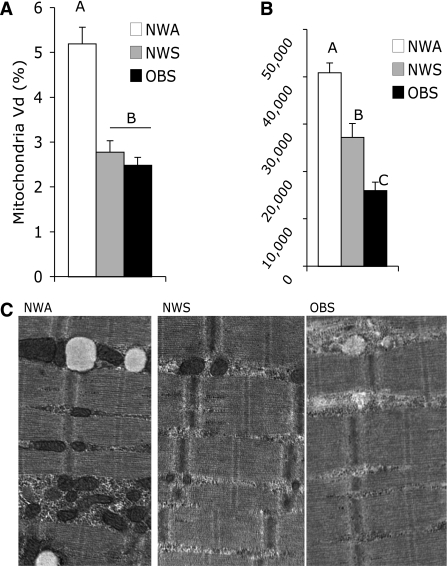
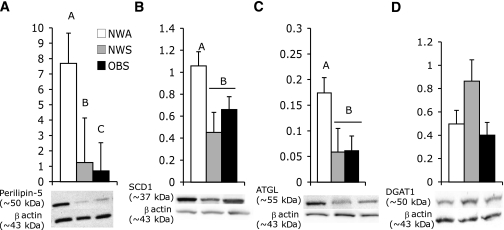
Results: DAG content in the NWA group was approximately twofold higher than in the OBS group and ~50% higher than in the NWS group, corresponding to higher insulin sensitivity. While certain DAG moieties clearly were associated with better insulin sensitivity, other species were not. Ceramide content was higher in insulin-resistant obese muscle. The expression of OXPAT/perilipin-5, adipose triglyceride lipase, and stearoyl-CoA desaturase protein was higher in the NWA group, corresponding to a higher mitochondrial content, proportion of type 1 myocytes, IMTGs, DAGs, and insulin sensitivity.
Conclusions: Total myocellular DAGs were markedly higher in highly trained athletes, corresponding with higher insulin sensitivity, and suggest a more complex role for DAGs in insulin action. Our data also provide additional evidence in humans linking ceramides to insulin resistance. Finally, this study provides novel evidence supporting a role for specific skeletal muscle proteins involved in intramyocellular lipids, mitochondrial oxidative capacity, and insulin resistance.
Figures
References
-
- Kelley DE, Goodpaster BH. Skeletal muscle triglyceride: an aspect of regional adiposity and insulin resistance. Diabetes Care 2001;24:933–941 - PubMed
-
- Lee JS, Pinnamaneni SK, Eo SJ, et al. Saturated, but not n-6 polyunsaturated, fatty acids induce insulin resistance: role of intramuscular accumulation of lipid metabolites. J Appl Physiol 2006;100:1467–1474 - PubMed
-
- Pan DA, Lillioja S, Kriketos AD, et al. Skeletal muscle triglyceride levels are inversely related to insulin action. Diabetes 1997;46:983–988 - PubMed
-
- Goodpaster BH, He J, Watkins S, Kelley DE. Skeletal muscle lipid content and insulin resistance: evidence for a paradox in endurance-trained athletes. J Clin Endocrinol Metab 2001;86:5755–5761 - PubMed
Publication types
MeSH terms
Substances
Grants and funding
LinkOut - more resources
Full Text Sources
Other Literature Sources
Medical
