. 2011 Dec;25(12):4274-91.
doi: 10.1096/fj.11-187682. Epub 2011 Aug 26.

Enhanced Ca2+ entry due to Orai1 plasma membrane insertion increases IL-8 secretion by cystic fibrosis airways

Affiliations

Enhanced Ca2+ entry due to Orai1 plasma membrane insertion increases IL-8 secretion by cystic fibrosis airways

Haouaria Balghi et al. FASEB J. 2011 Dec.

Abstract

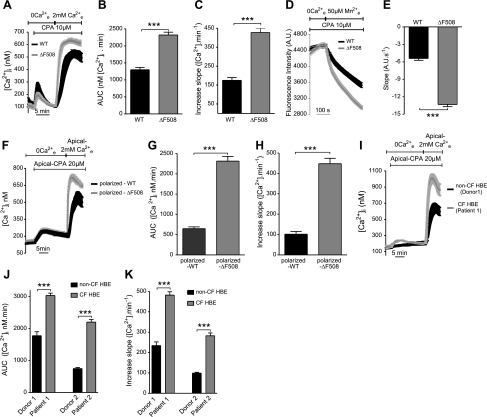
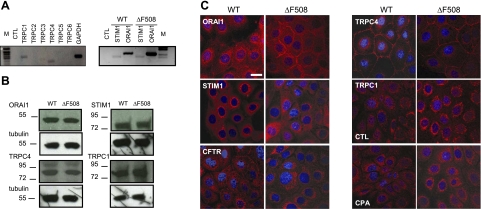
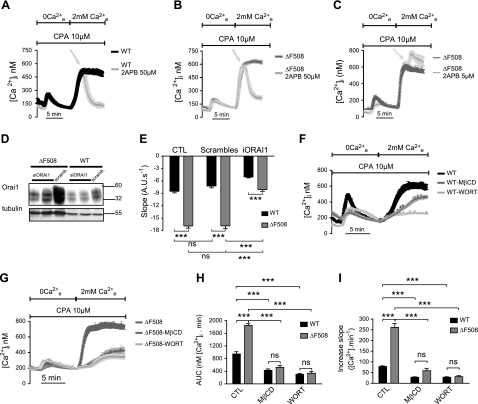
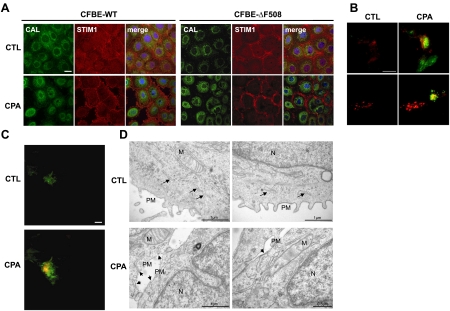
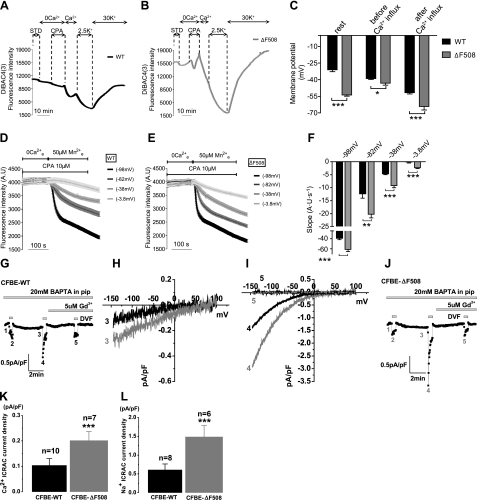
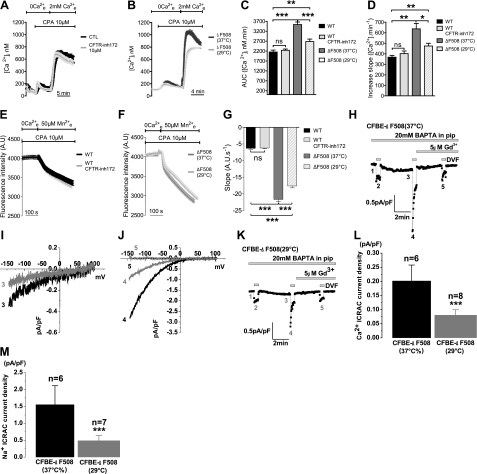
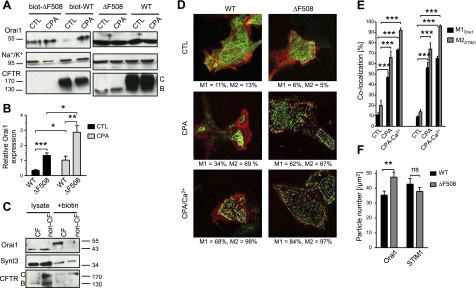
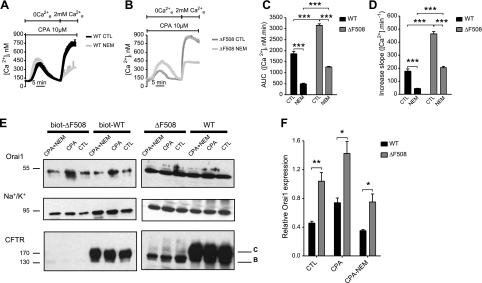
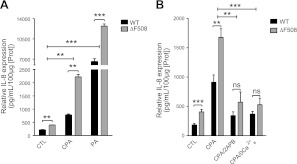
Cystic fibrosis (CF) is caused by mutations in the gene encoding the CF transmembrane conductance regulator (CFTR). The most common mutation, ΔF508, causes retention of CFTR in the endoplasmic reticulum (ER). Some CF abnormalities can be explained by altered Ca(2+) homeostasis, although it remains unknown how CFTR influences calcium signaling. This study examined the novel hypothesis that store-operated calcium entry (SOCE) through Orai1 is abnormal in CF. The significance of Orai1-mediated SOCE for increased interleukin-8 (IL-8) expression in CF was also investigated. CF and non-CF human airway epithelial cell line and primary cells (obtained at lung transplantation) were used in Ca(2+) imaging, electrophysiology, and fluorescence imaging experiments to explore differences in Orai1 function in CF vs. non-CF cells. Protein expression and localization was assessed by Western blots, cell surface biotinylation, ELISA, and image correlation spectroscopy (ICS). We show here that store-operated Ca(2+) entry (SOCE) is elevated in CF human airway epithelial cells (hAECs; ≈ 1.8- and ≈ 2.5-fold for total Ca(2+)(i) increase and Ca(2+) influx rate, respectively, and ≈ 2-fold increase in the I(CRAC) current) and is caused by increased exocytotic insertion (≈ 2-fold) of Orai1 channels into the plasma membrane, which is normalized by rescue of ΔF508-CFTR trafficking to the cell surface. Augmented SOCE in CF cells is a major factor leading to increased IL-8 secretion (≈ 2-fold). CFTR normally down-regulates the Orai1/stromal interaction molecule 1 (STIM1) complex, and loss of this inhibition due to the absence of CFTR at the plasma membrane helps to explain the potentiated inflammatory response in CF cells.


Figures

Figure 1.
Figure 1.
SOCE is enhanced in CF hAECs. [Ca2+]i was measured using the Ca2+ probe Fura-2. A) Time course of [Ca2+]i when cells were exposed to CPA (10 μM) in Ca2+-free saline to deplete intracellular stores and Ca2+ was added back to the extracellular medium. Calcium readdition produced a much larger Ca2+i increase in CFBE-ΔF508 cells (gray trace, n=78 cells) compared to -WT cells (black trace, n=71 cells). B, C) AUC calculated during the first 5 min after readding Ca2+e to CFBE-WT (black bar) and -ΔF508 (gray bar) cells with depleted stores (B), and slope calculated during the first minute of Ca2+ entry in CFBE-WT (black bar) and -ΔF508 (gray bar) cells (C). Data are means ± se of 86 WT and 113 ΔF508 cells. D) Representative experiment showing the time course of Mn2+ quenching after depleting stores in CFBE-WT (black trace) and -ΔF508 (gray trace) cells. E) Rate of net influx into CFBE-WT (black) and -ΔF508 (gray) cells after store depletion. Data are means ± se of 41 WT and 52 ΔF508 cells. F) SOCE is enhanced in polarized monolayers of cells expressing ΔF508- (gray trace) compared to WT-CFTR (black trace). After ER store depletion by CPA application, a larger Ca2+i increase was observed in polarized CFBE-ΔF508 (gray trace) compared to -WT monolayers (black trace) when extracellular Ca2+ was present only on the apical side. G, H) AUC (G) and slope (H) in polarized CFBE-WT (black bar) and -ΔF508 (gray bar) monolayers. Data are means ± se of 25 WT and 10 ΔF508 cells. I) SOCE is also augmented in polarized CF-HBE (gray trace) compared to non-CF cells (black trace). J, K) AUC (J) and slope (K) in polarized non-CF (black bar) and CF-HBE (gray bar) monolayers. Data are means ± se of 6, 7, 3, and 3 culture inserts from donor 1, patient 1, donor 2, and patient 2, respectively.
Figure 2.
Figure 2.
Expression and localization of endogenous Ca2+ signaling proteins in CFBE cells. A) Left panel: agarose gel showing that TRPC1 and TRPC4 were detected in CFBE cells by RT-PCR, but not other TRPC family members (TRPC2, 3, 5, and 6). Right panel: STIM1 and ORAI1 mRNAs were also expressed in both CFBE-WT and -ΔF508 cells. B) Endogenous Orai1, STIM1, TRPC4, and TRPC1 proteins are expressed at similar levels in CFBE-WT and -ΔF508 cells. C) Immunolocalization of Orai1, STIM1, CFTR, TRPC4, and TRPC1 in CFBE-WT and -ΔF508 cells. All these proteins were stained with Texas-Red, and nuclei were stained blue with DAPI. Scale bar = 20 μm. Note PM staining of Orai1, TRPC4, and WT-CFTR, and the perinuclear localization of TRPC1, STIM1, and ΔF508-CFTR.
Figure 3.
Figure 3.
Orai1 and its signaling complex mediate SOCE. A–C) 2-APB used at high concentration (50 μM) abolishes SOCE in CFBE-WT (A) and -ΔF508 (B), while at low concentration (5 μM), 2-APB activates SOCE (C). Traces are means ± se of 23 and 31 CFBE-WT cells and 22 and 48 CFBE-ΔF508 cells in control and 50 μM 2-APB treatment groups, respectively, and 9 and 6 CFBE-ΔF508 cells in control and 5 μM 2-APB treatment groups, respectively. D) Representative blot showing the effect of siRNA on Orai1 expression in CFBE-WT (10 μg) and -ΔF508 (20 μg) cells. Tubulin was used as an internal control. E) Silencing Orai1 expression reduces the rate of Mn2+ quenching in CFBE-WT (black bars) and -ΔF508 cells (gray bars). Data are means ± se of 21, 23, and 37 CFBE-WT cells and 23, 27, and 43 CFBE-ΔF508 cells under control, scrambled, and Orai1 siRNA-treated conditions, respectively. F, G) Time course of Ca2+ influx in CFBE-WT (black; F) and -ΔF508 (dark gray; G) cells, respectively, under control conditions and after pretreatment with MβCD (2 mM, gray) or wortmannin (10 μM, light gray). Traces are means ± se of 9, 5, and 18 CFBE-WT cells and 11, 14, and 11 cells CFBE-ΔF508 cells in control, MβCD, and wortmannin treatments, respectively. H, I) AUC (H) and the increase in slope (I), as measured for CFBE-WT (black) and -ΔF508 (gray) cells under control conditions and when treated with MβCD or wortmannin. Data are means ± se of 51, 46, and 50 CFBE-WT cells and 45, 49, and 25 CFBE-ΔF508 cells in control, MβCD, and wortmannin treatments, respectively.
Figure 4.
Figure 4.
ΔF508-CFTR does not influence the translocation of STIM1 and the ER toward the PM after Ca2+ store depletion. A) Confocal images of CFBE-WT and -ΔF508 cells showing STIM1 (red), the ER-resident protein calreticulin (green), and the nucleus (DAPI, blue). Top panels: control conditions (CTL). Bottom panels: after treatment with 10 μM CPA. B) TIRF microscopy of HEK-ΔF508 (top panels) and -WT cells (bottom panels) expressing STIM1-GFP and Orai1-mCherry (kindly provided by Richard Lewis, Stanford University School of Medicine) under control conditions (left images) and after store depletion with 10μM CPA (CPA; right images). Only the red labeling of Orai1 was detected under control conditions; however, green STIM1 was recruited to the PM after CPA treatment. Yellow indicates regions that contain both GFP and mCherry signals, suggesting colocalization of STIM1 and Orai1. C) HEK-ΔF508 cells were transfected with Ds-Red-KDEL (ER marker) and GAP-GFP (PM marker) and imaged using TIRF microscopy. Top panel: only the green PM was detected under control conditions (CTL); ER (red) was not observed. Bottom panel: after store depletion (10 min CPA), the ER appeared and became colocalized with GAP-GFP, indicating movement of the ER close to the cell surface. D) Representative electron microscopy images before (top panels) and after CPA treatment (bottom panels) in CFBE-ΔF508 cells. Nuclei (N), mitochondria (M), and ER (black arrows) are shown. After CPA treatment, the ER was clearly juxtaposed with the membrane. Scale bars = 20 μm (A–C) or as indicated (D).
Figure 5.
Figure 5.
Increased Orai1-mediated current in CFBE-ΔF508 cells is not through changes in the membrane potential. A, B) Time courses of the MP during the SOCE in CFBE-WT (A) and -ΔF508 cells (B). Traces are means ± se of 21 and 15 cells in CFBE-WT and -ΔF508, respectively. C) Summary of the MP at rest, after CPA-induced store depletion (before the influx was triggered) and after the addition of Ca2+ back to the extracellular medium. Results are from 57 and 54 CFBE-WT (black bars) and -ΔF508 cells (gray bars), respectively. Store depletion nearly abolished differences in the MP between CFBE-WT and -ΔF508 cells under CTL conditions. D, E) Representative traces showing Mn2+ quenching rate when the membrane potential was measured and clamped at −98, −82, −38, and −3.8 mV during SOCE by elevating extracellular potassium in CFBE-WT (D) and −ΔF508 cells (E). F) Summary of the quench rates estimated during the first 20 s after Mn2+ addition in CFBE-WT (black bars) and -ΔF508 cells (gray bars). Note that Mn2+ entry into CFBE-ΔF508 cells was significantly faster at all membrane potentials studied. Data are means ± se of ∼30 cells for all conditions. G–L) CFBE-ΔF508 cells show larger CRAC current (ICRAC) compared to CFBE-WT cells. G, J) CFBE-WT (G) and -ΔF508 cells (J) were dialyzed with a pipette solution containing 20 mM BAPTA to induce store depletion, and whole-cell currents were measured in the presence of 20 mM Ca2+e and after applying pulses of DVF bath solutions to amplify CRAC currents. Currents recorded in DVF solutions show the typical depotentiation reminiscent of Na+ CRAC currents. Low concentrations of lanthanides (5 μM Gd3+) shown to inhibit Orai1-mediated CRAC currents were used at the end of the recordings. Data points from each ramp were taken at −100 mV and plotted. Small inwardly rectifying ICRAC currents developed in both cell types and were greatly amplified under DVF conditions. H) The I/V relationships show larger Ca2+ ICRAC in CFBE-ΔF508 cells than in -WT cells. I). Similarly, the I/V relationships measured in DVF solutions show larger Na+ ICRAC in CFBE-ΔF508 than in -WT cells, which are completely blocked by 5 μM Gd3+. In all sweeps represented in panels H and I, leak currents were subtracted. K, L) Data summary of Ca2+ ICRAC density in CFBE-WT (n=10) and -ΔF508 (n=7) cells (K) and of monovalent ICRAC density in CFBE-WT (n=8) and -ΔF508 (n=6) cells (L).
Figure 6.
Figure 6.
SOCE is reduced when ΔF508-CFTR trafficks to the PM, but does not depend on CFTR channel activity. A) Traces of Ca2+i measured in CFBE-WT cells under control conditions (black trace) and after treatment with the CFTR channel inhibitor CFTRinh172 (10 μM; light gray trace). B) Similar experiment with CFTR-ΔF508 cells under control conditions (gray trace) and after incubation at 29°C for 24 h to correct trafficking of the mutant protein (light gray trace). Traces are means ± se of 14–15 CFBE-WT cells and 20–21 CFBE-ΔF508 cells. C, D) AUC (C) and slope (D) of Ca2+i increase in CFBE-WT (control, black bars; CFTRinh172, dark gray bars) and CFBE-ΔF508 cells (control, gray bars; 29°C, light gray bars). Data are means ± se of 27–44 CFBE-WT cells and 39–58 CFBE-ΔF508 cells. E, F) Rate of Mn2+ quench confirms the dependence of SOCE on correction of ΔF508-CFTR trafficking rather than its channel activity, in both CFBE-WT (E; control, black trace; CFTRinh172, light gray trace) and -ΔF508 cells (F; control, gray trace; 29°C, light gray trace). Traces are means ± se of ∼15 cells/condition. G) Summary of the Mn2+ quenching rate measured in 30–36 CFBE-WT cells and 46–90 CFBE-ΔF508 cells. Orai1-mediated current is lowered when ΔF508-CFTR is trafficked to the PM by low-temperature treatment. H–M) ICRAC is normalized by rescue of ΔF508-CFTR trafficking to the cell surface induced by low-temperature treatment. ICRAC was measured in CFBE-ΔF508 cells cultured at 37°C (H) or at 29°C (K) using the same protocol as described in Fig. 5G–L. I/V curves show that 29°C treatment diminished the Ca2+ ICRAC (I) and the Na+ ICRAC (J) in CFBE-ΔF508 cells compared to those incubated at 37°C and were blocked by 5μM Gd3+ (J). L) Data summary of divalent ICRAC density in CFBE-ΔF508 cells at 37°C (n=6) or 29°C (n=8). M) Data summary of monovalent ICRAC density in CFBE-ΔF508 cells at 37°C (n=6) or at 29°C (n=7).
Figure 7.
Figure 7.
Increased expression of endogenous Orai1 at the cell surface in CFBE-ΔF508 and human primary CF cells. A) Cell surface biotinylation of Orai1, Na+/K+ pump, and CFTR proteins in CFBE-WT and -ΔF508 cells. Left panels: representative Western blots of streptavidin pulldowns showing that more Orai1 was biotinylated under control conditions in CFBE-ΔF508 (lane 1) than in -WT cells (lane 3), and that more Orai1 was biotinylated during SOCE (CPA). Right panels: total protein expression in lysates. Note that band B CFTR corresponding to the immature ER form was not detectable at the cell surface, thus providing a control for biotinylation of cell surface proteins. B) Semiquantitative analysis of Orai1 expression at the surface of CFBE-WT and -ΔF508 cells under control conditions (light gray bars) and during SOCE (CPA; gray bars), normalized to biotinylated α subunit of the Na+/K+ pump. Data are means ± se of 5 experiments. C) Apical cell surface biotinylation of Orai1, Syntaxin 3 and CFTR proteins in polarized human primary CF and non-CF cells. Left panels: total protein expression in lysates. Right panels: representative Western blots of streptavidin pulldowns showing that more Orai1 was biotinylated at the apical surface under control conditions in CF monolayers (lane 3) than in non-CF (lane 4). D–F) Orai1-mCherry and STIM1-GFP colocalization and particle number measured by image correlation and cross-correlation spectroscopy (ICS and ICCS) under control (CTL) conditions, after CPA application (CPA) and during SOCE (CPA + Ca2+) in CFBE-WT vs. -ΔF508 cells. D) Representative confocal images of each condition with the region analyzed indicated by a white polygon. M1 is the percentage of Orai1 colocalized with STIM1 and M2 the percentage of STIM1 colocalized with Orai1 (See Materials and Methods). E) Histogram of Orai1 and STIM1 cluster colocalization in CFBE-WT and -ΔF508 cells. F) Histogram of particle densities measured inside Orai1/STIM1 clusters during the calcium entry into CFBE-WT (black bars) vs. -ΔF508 cells (gray bars). Data are means ± se of 52 CFBE-WT and 41 CFBE-ΔF508 cells.
Figure 8.
Figure 8.
Orai1 insertion into the PM is enhanced in CFBE-ΔF508 cells. A–D) Inhibiting exocytosis by NEM reduces SOCE. A, B) Time course of [Ca2+]i showing the inhibition of SOCE when NEM is added along with 2 mM extracellular Ca2+ in CFBE-WT (A; control, black trace; NEM, dark gray trace) and CFBE-ΔF508 cells (B; control, gray trace; NEM, light gray trace). Traces are means ± se of ∼10 cells/condition. C, D) AUC (C) and initial slope (D) measured in CFBE-WT (black bars) and -ΔF508 cells (gray bars) treated with NEM as compared to control. Data are means ± se of 15–32 CFBE-WT cells and 16–19 CFBE-ΔF508 cells. E, F) Cell surface biotinylation studies showing Orai1, Na+/K+ pump and CFTR proteins expression in cells treated with NEM during SOCE. E) Left panels: Western blots showing increase in biotinylated Orai1 during SOCE in CFBE-ΔF508 cells (lanes 2 vs. 3) and CFBE-WT cells (lanes 5 vs. 6) and its inhibition by NEM (lanes 1 vs. 2 and 4 vs. 5). Blocking exocytosis with NEM drastically reduced Orai1 expression on the cell surface in CFBE-WT and -ΔF508 cells. Orai1 cell surface expression was always higher in CFBE-ΔF508 than in -WT cells. F) Semiquantitative analysis of Orai1 expression at the surface of CFBE-WT (black bars) and -ΔF508 (gray bars) cells under control conditions and after exposure to CPA with or without NEM treatment, normalized to biotinylated α subunit of the Na+/K+ pump. Data are means ± se of 3 experiments. Note that inhibiting exocytosis with NEM under these conditions did not noticeably affect total Orai1 protein expression or surface expression of the Na/K pump.
Figure 9.
Figure 9.
Orai1-mediated SOCE induces higher IL-8 secretion in CFBE-ΔF508 cells. A) Effects of CPA and PA on IL-8 secretion in CFBE-WT (black bars) and -ΔF508 cells (gray bars). CFBE cells were grown on filters to polarize and were left untreated or treated with 20 μM CPA or PA (108 CFU/ml) for 4 h at 37°C. Samples were collected from the apical side of the filters, and IL-8 was measured by ELISA. Data are means ± se of 3 experiments. B) Inhibiting Orai1 dramatically reduces IL-8 secretion in CFBE-WT and -ΔF508 cells. Cells grown on filters were untreated or treated with 20 μM CPA with or without SOCE inhibitors (100 μM 2-APB or Ca2+-free solution). Data are means ± se of 5 experiments.

References

    1. Gadsby D. C., Vergani P., Csanady L. (2006) The ABC protein turned chloride channel whose failure causes cystic fibrosis. Nature 440, 477–483 - PMC - PubMed
    1. Rommens J. M., Zengerling S., Burns J., Melmer G., Kerem B. S., Plavsic N., Zsiga M., Kennedy D., Markiewicz D., Rozmahel R., Riordan J. R., Buchwald M., Tsui L.-C. (1988) Identification and regional localization of DNA markers on chromosome 7 for the cloning of the cystic fibrosis gene. Am. J. Hum. Genet. 43, 645–663 - PMC - PubMed
    1. Riordan J. R., Rommens J. M., Kerem B., Alon N., Rozmahel R., Grzelczak Z., Zielenski J., Lok S., Plavsic N., Chou J. L., Drumm M. L., Iannuzzi M. C., Collins F. S., Tsui L. C. (1989) Identification of the cystic fibrosis gene: cloning and characterization of complementary DNA. Science 245, 1066–1073 - PubMed
    1. Hanrahan J. W., Wioland M. A. (2004) Revisiting cystic fibrosis transmembrane conductance regulator structure and function. Proc. Am. Thorac. Soc. 1, 17–21 - PubMed
    1. Naren A. P., Cobb B., Li C., Roy K., Nelson D., Heda G. D., Liao J., Kirk K. L., Sorscher E. J., Hanrahan J., Clancy J. P. (2003) A macromolecular complex of beta 2 adrenergic receptor, CFTR, and ezrin/radixin/moesin-binding phosphoprotein 50 is regulated by PKA. Proc. Natl. Acad. Sci. U. S. A. 100, 342–346 - PMC - PubMed

Publication types

MeSH terms