. 2011 Dec;66(12):1286-99.
doi: 10.1093/gerona/glr125. Epub 2011 Aug 26.

Thioredoxin 1 overexpression extends mainly the earlier part of life span in mice

Affiliations

Thioredoxin 1 overexpression extends mainly the earlier part of life span in mice

Viviana I Pérez et al. J Gerontol A Biol Sci Med Sci. 2011 Dec.

Abstract

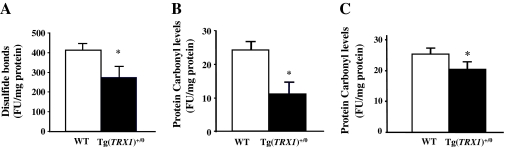
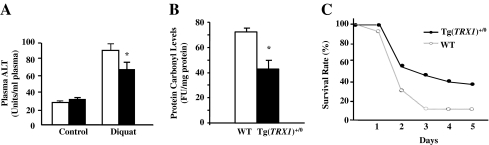
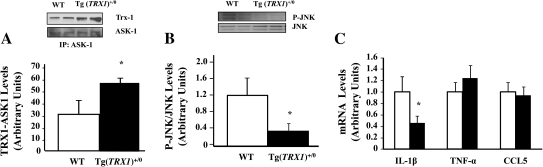
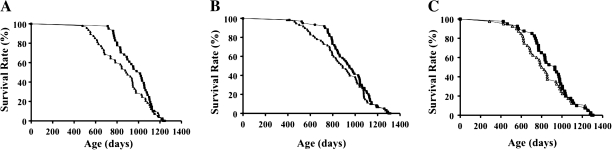
We examined the effects of increased levels of thioredoxin 1 (Trx1) on resistance to oxidative stress and aging in transgenic mice overexpressing Trx1 [Tg(TRX1)(+/0)]. The Tg(TRX1)(+/0) mice showed significantly higher Trx1 protein levels in all the tissues examined compared with the wild-type littermates. Oxidative damage to proteins and levels of lipid peroxidation were significantly lower in the livers of Tg(TRX1)(+/0) mice compared with wild-type littermates. The survival study demonstrated that male Tg(TRX1)(+/0) mice significantly extended the earlier part of life span compared with wild-type littermates, but no significant life extension was observed in females. Neither male nor female Tg(TRX1)(+/0) mice showed changes in maximum life span. Our findings suggested that the increased levels of Trx1 in the Tg(TRX1)(+/0) mice were correlated to increased resistance to oxidative stress, which could be beneficial in the earlier part of life span but not the maximum life span in the C57BL/6 mice.


Figures

Figure 1.
Figure 1.
Overexpression of Trx1 in Tg(TRX1)+/0 mice. The levels of Trx1 protein were determined by Western blot in various tissues of young (4–6 months old [Graph A: left, top]), middle (14–16 months old [Graph B: right, top]), and old (26–28 months old [Graph C: left, bottom]) aged Tg(TRX1)+/0 (closed bars) and wild-type (WT) mice (open bars). The data are the mean ± SEM from three to five mice. Trx1 was significantly higher (*) in the tissues of the Tg(TRX1)+/0 mice compared with WT mice (p < .05). Western blots for liver samples from each age group are shown with their respective graphs. Graph D (right, bottom) gives the percent overexpression of Trx1 in the lung, liver, spleen, and brain of Tg(TRX1)+/0 mice compared with WT mice at the three ages studied. These data were obtained from Graphs A, B, and C.
Figure 2.
Figure 2.
Redox state of Trx1 and Trx Reductase activity in Tg(TRX1)+/0 mice. The redox state of Trx1 (Graph A: left) was measured in liver cytosolic fractions from young (4–6 months old) Tg(TRX1)+/0 and wild-type (WT) mice by Redox Western blot using AMS as the alkylating agent. The redox state of Trx1 in the liver was significantly increased (30%) in Tg(TRX1)+/0 mice (closed bar) compared with WT mice (open bar). The activity of Trx reductase (Graph B: right) was measured in liver from young (4–6 months old) Tg(TRX1)+/0 and WT mice. Trx reductase activity showed a significant increase in the liver of Tg(TRX1)+/0 mice (closed bar) compared with WT mice (open bar). The data are the mean of six animals ± SEM; the asterisk denotes those values that are significantly different from WT mice at the p ≤ .05 level.
Figure 3.
Figure 3.
Redox states of GSH and free cysteine in Tg(TRX1)+/0 mice. GSH in liver (Graph A: left) and free cysteine (CySH/CySS [Graph B: middle]) and GSH (Graph C: right) in plasma of young mice (4–6 months old) were measured using N-dansyl derivatives and high-performance liquid chromatography with fluorescence detection. The redox state of GSH was similar in the liver from Tg(TRX1)+/0 mice (closed bar) and wild-type mice (open bar). No significant changes were observed in the redox state of free cysteine (CySH/CySS) or of GSH in plasma. The data are the mean of six animals ± SEM.
Figure 4.
Figure 4.
Levels of Trx2 and glutaredoxin in the tissues of Tg(TRX1)+/0 and wild-type (WT) mice. The levels of Trx2 (Graph A: left) and glutaredoxin (Graph B: right) were measured in liver from young (4–6 months old) Tg(TRX1)+/0 mice (closed bar) and WT mice (open bar) by Western blot. Western blots are shown with their respective graphs. No significant difference was observed in Trx2 or glutaredoxin levels in the liver of Tg(TRX1)+/0 mice compared with WT mice. The data in Graphs A and B are the mean ± SEM from three to five mice.
Figure 5.
Figure 5.
Levels of total glutathione in the tissues of Tg(TRX1)+/0 and wild-type (WT) mice. The levels of total glutathione were measured in liver, kidney, and brain homogenates from young mice (4–6 months old). The data in the Graphs are the mean ± SEM from three mice. The levels of total glutathione levels in liver were slightly higher in the Tg(TRX1)+/0 mice (closed bar) compared with WT mice (open bar). The levels of total glutathione levels in kidney and brain were similar in Tg(TRX1)+/0 and WT mice.
Figure 6.
Figure 6.
Cu/ZnSOD, MnSOD, catalase, and GPX activity in tissues of the Tg(TRX1)+/0 mice. The activities of Cu/ZnSOD (Graph A: left, top), MnSOD (Graph B: right, top), catalase (Graph C: left, bottom), and GPX (Graph D: right, bottom) were measured in tissue extracts from young mice (4–6 months old). Cu/ZnSOD and MnSOD activity gels are shown with their respective graphs. Data are the mean ± SEM of three Tg(TRX1)+/0 and three wild-type (WT) mice. The activities of Cu/Zn-SOD, MnSOD, catalase, and GPX were similar between Tg(TRX1)+/0 (closed bar) and WT mice (open bar).
Figure 7.
Figure 7.
Protein oxidation in the liver of Tg(TRX1)+/0 and wild-type (WT) mice. The levels of disulfide bonds (Graph A: left) in the liver were measured by a disulfide detection assay. The levels of protein carbonyls were measured using a fluorescence-based method in 4–6 months old (Graph B: middle) and 26–28 months old (Graph C: right) Tg(TRX1)+/0 mice (closed bar) and WT mice (open bar). The data in Graphs A, B, and C are the mean ± SEM from three to five mice, and the data that are significantly lower (p < .05) in the Tg(TRX1)+/0 mice compared with WT mice are indicated by asterisk (*).
Figure 8.
Figure 8.
Levels of F2-isoprostanes in the serum and DNA oxidation in the liver of Tg(TRX1)+/0 and wild-type (WT) mice. Serum from Tg(TRX1)+/0 (closed bar) and WT (open bar) mice were processed, and F2-isoprostanes levels were measured at 26–28 months of age. The F2-isoprostanes levels in the serum from Tg(TRX1)+/0 mice were approximately 20% lower compared with age-matched WT control (Graph A: left). The data are obtained from the serum of nine mice per group. Levels of DNA oxidation in the liver of Tg(TRX1)+/0 (closed bar) and WT (open bar) mice at 26–28 months of age showed no significant difference (Graph B: right).
Figure 9.
Figure 9.
Effect of diquat treatment on hepatotoxicity, protein oxidation, and survival of young (4–6 months old) Tg(TRX1)+/0 and wild-type (WT) mice. The plasma ALT levels (Graph A: left) were significantly higher (p < .05 level) after diquat injection in both Tg(TRX1)+/0 (closed bar) and WT (open bar) mice compared with untreated groups (*). The Tg(TRX1)+/0 mice (closed bar) showed significantly lower plasma ALT levels than WT mice (open bar) after diquat injection (*). The data for plasma ALT levels are expressed as the mean ± SEM from five mice. Protein carbonyl levels of Tg(TRX1)+/0 and WT mice after 50 mg/kg diquat injection are shown in Graph B (middle). The data for protein carbonyl levels are expressed as the mean ± SEM from five mice. The Tg(TRX1)+/0 mice showed significantly lower protein carbonyl levels than WT mice after diquat injection. Survival curves of Tg(TRX1)+/0 and WT mice after the intraperitoneal injection of 60 mg/kg body weight diquat are shown in Graph C (right). Tg(TRX1)+/0 mice had increased resistance to oxidative stress compared with WT mice. Approximately 6.6% of the WT mice were viable 3 days after diquat injection, whereas 50% of the Tg(TRX1)+/0 mice were viable.
Figure 10.
Figure 10.
Levels of ASK1/Trx1 complex, JNK phosphorylation, and inflammatory gene expression in Tg(TRX1)+/0 and wild-type (WT) mice. Levels of ASK1/Trx1 complex and phosphorylated JNK were measured by Western blot analysis in cytosolic liver fractions from young mice (4–6 months old). Western blots for ASK1/Trx1 complex and phosphorylated JNK are shown with their respective graphs. The expression of inflammatory genes was measured by the levels of interleukin (IL)-1β, CCL5, and tumor necrosis factor (TNF) α using quantitative real-time polymerase chain reaction. Levels of ASK1/Trx1 complex were significantly higher in Tg(TRX1)+/0 compared with WT mice (Graph A: left). Levels of phosphorylated JNK were significantly lower in Tg(TRX1)+/0 compared with WT mice (Graph B: middle). Levels of IL-1β messenger RNA (mRNA) were significantly lower in the livers from young (4–6 months old) Tg(TRX1)+/0 mice compared with WT mice (Graph C: right). Levels of CCL5 (chemokine) and TNF-α mRNA were similar in the livers from young (4–6 months old) Tg(TRX1)+/0 and WT mice. The data are the mean of three to five animals ± SEM. The asterisk denotes those values that are significantly different from WT mice at the p ≤ .05 level.
Figure 11.
Figure 11.
The survival curves of Tg(TRX1)+/0 and wild-type (WT) mice. Survival curves of Tg(TRX1)+/0 and WT mice from two cohorts are presented. The first cohort consists of 48 male WT and 41 male Tg(TRX1)+/0 mice (Graph A: left), and the second cohort consists 60 male WT and 60 male Tg(TRX1)+/0 mice (Graph B: middle) and 40 female WT and 40 female Tg(TRX1)+/0 mice (Graph C: right). The survival curves were compared statistically using the log-rank test. The survival curves were not significantly different between Tg(TRX1)+/0 and WT mice. The male Tg(TRX1)+/0 mice showed significant increases in 90% survival (both cohorts), and only the first male cohort showed a significant increase in 75% survival compared with WT mice. However, we found no difference in the median, 25%, and 10% survival between Tg(TRX1)+/0 and WT mice in two male cohorts. In females, although the Tg(TRX1)+/0 mice seemed to extend life span in the earlier part of life compared with WT mice, none of the survivals parameters were statistically significant.

References

    1. Tagaya Y, Maeda Y, Mitsui A, et al. ATL-derived factor (ADF), an IL-2 receptor/Tac inducer homologous to thioredoxin; possible involvement of dithiol-reduction in the IL-2 receptor induction. EMBO J. 1989;8:757–764. - PMC - PubMed
    1. Spyrou G, Enmark E, Miranda-Vizuete A, Gustafsson JA. Cloning and expression of a novel mammalian thioredoxin. J Biol Chem. 1997;272:2936–2941. - PubMed
    1. Matsui M, Oshima M, Oshima H, Takaku K, Maruyama T, Yodoi J. Early embryonic lethality caused by targeted disruption of the mouse thioredoxin gene. Dev Biol. 1996;178:179–185. - PubMed
    1. Nonn L, Williams RR, Erickson RP, Powis G. The absence of mitochondrial thioredoxin 2 causes massive apoptosis, exencephaly, and embryonic lethality in homozygous mice. Mol Cell Biol. 2003;23:916–922. - PMC - PubMed
    1. Chae HZ, Kim HJ, Kang SW, Rhee SG. Characterization of three isoforms of mammalian peroxiredoxin that reduce peroxides in the presence of thioredoxin. Diabetes Res Clin Pract. 1999;45:101–112. - PubMed

Publication types

MeSH terms