. 2011 Oct 28;286(43):37676-91.
doi: 10.1074/jbc.M111.250449. Epub 2011 Aug 27.

Human 1-acylglycerol-3-phosphate O-acyltransferase isoforms 1 and 2: biochemical characterization and inability to rescue hepatic steatosis in Agpat2(-/-) gene lipodystrophic mice

Affiliations

Human 1-acylglycerol-3-phosphate O-acyltransferase isoforms 1 and 2: biochemical characterization and inability to rescue hepatic steatosis in Agpat2(-/-) gene lipodystrophic mice

Anil K Agarwal et al. J Biol Chem. .

Abstract

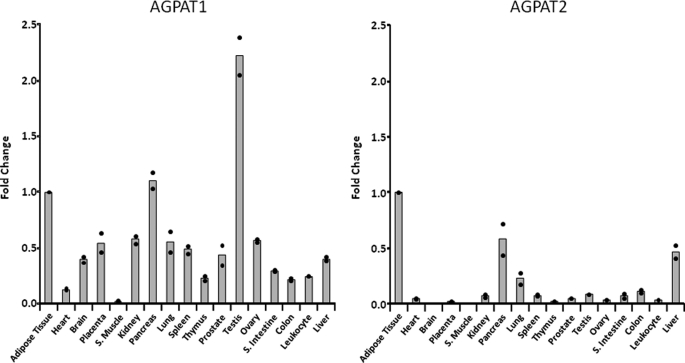
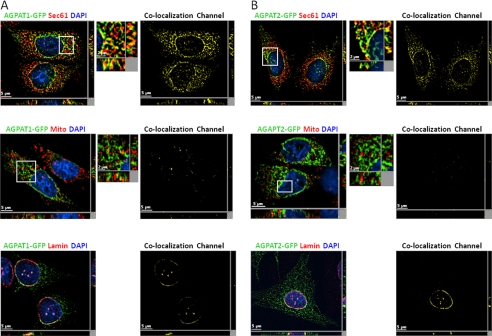
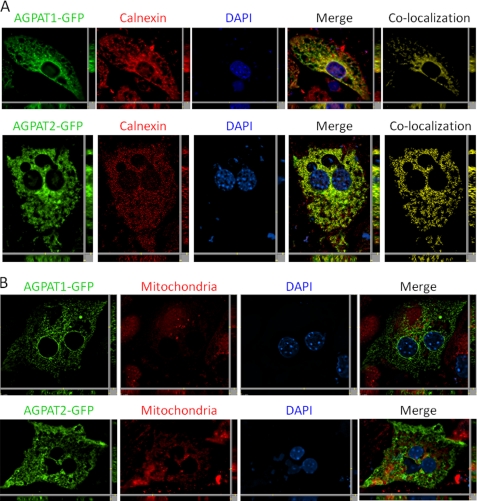
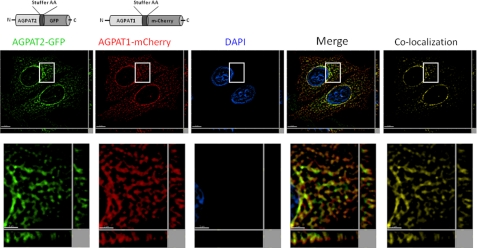
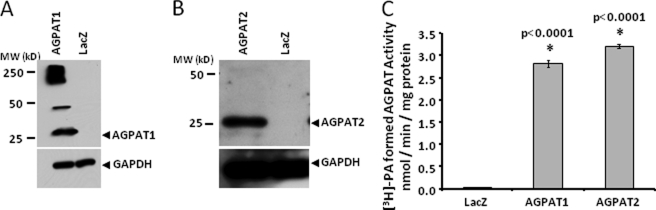
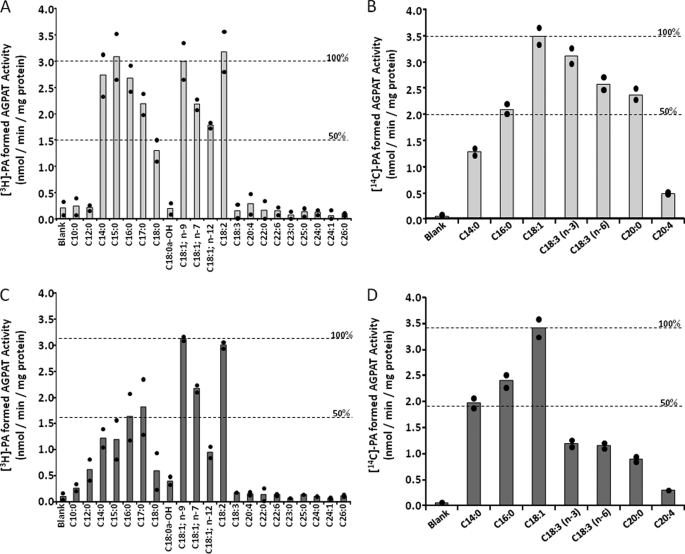
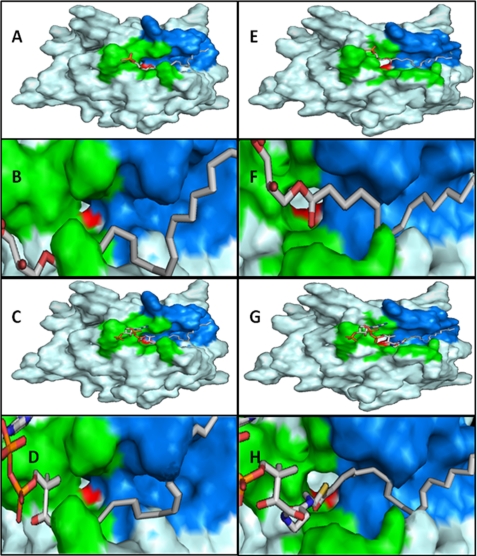
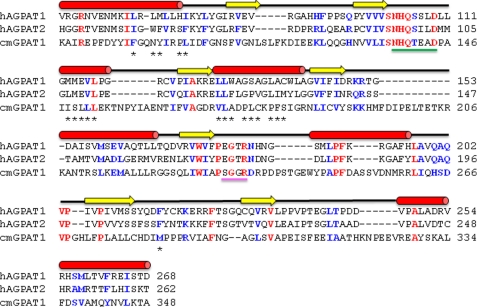
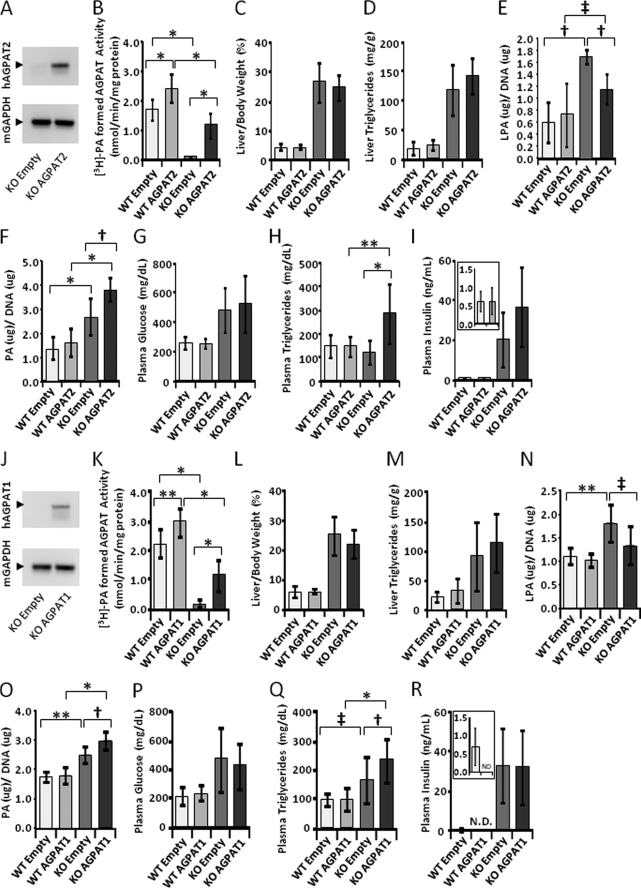
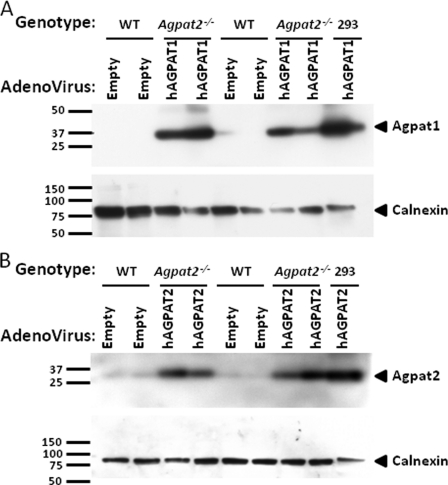
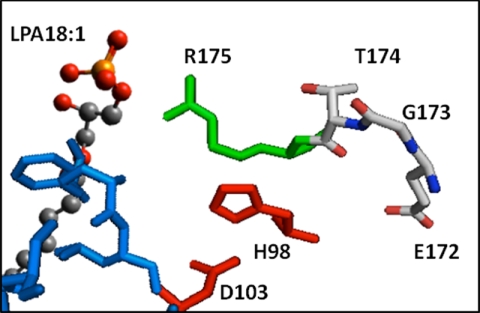
Loss-of-function mutations in 1-acylglycerol-3-phosphate O-acyltransferase (AGPAT) 2 in humans and mice result in loss of both the white and brown adipose tissues from birth. AGPAT2 generates precursors for the synthesis of glycerophospholipids and triacylglycerols. Loss of adipose tissue, or lipodystrophy, results in hyperinsulinemia, diabetes mellitus, and severe hepatic steatosis. Here, we analyzed biochemical properties of human AGPAT2 and its close homolog, AGPAT1, and we studied their role in liver by transducing their expression via recombinant adenoviruses in Agpat2(-/-) mice. The in vitro substrate specificities of AGPAT1 and AGPAT2 are quite similar for lysophosphatidic acid and acyl-CoA. Protein homology modeling of both the AGPATs with glycerol-3-phosphate acyltransferase 1 (GPAT1) revealed that they have similar tertiary protein structure, which is consistent with their similar substrate specificities. When co-expressed, both isoforms co-localize to the endoplasmic reticulum. Despite such similarities, restoring AGPAT activity in liver by overexpression of either AGPAT1 or AGPAT2 in Agpat2(-/-) mice failed to ameliorate the hepatic steatosis. From these studies, we suggest that the role of AGPAT1 or AGPAT2 in liver lipogenesis is minimal and that accumulation of liver fat is primarily a consequence of insulin resistance and loss of adipose tissue in Agpat2(-/-) mice.


Figures

FIGURE 1.
FIGURE 1.
Expression of human AGPAT1 and AGPAT2 in tissues. The ΔCt values are shown as quantified by TaqMan real time PCR. Shown as ●, the individual fold changes to adipose tissue (individual ΔCt values were normalized to internal control, G3PDH). The bars represent the mean fold changes as compared with adipose tissue taken as one. Fold increase between various tissues were calculated as 2−ΔΔCt (56). A, AGPAT1; B, AGPAT2. S. muscle, skeletal muscle and S. intestine, small intestine.
FIGURE 2.
FIGURE 2.
Localization of AGPAT1-EGFP and AGPAT2-EGFP to endo-membranes in cultured cells. A, CHO cells overexpressing AGPAT1-EGFP were fixed in methanol, incubated with antibody sec61-β (specific for endoplasmic reticulum) and lamin A/C (specific for nuclear lamina), and imaged for green and red fluorescence using fluorescence microscopy. Shown are representative images for AGPAT1 (green fluorescence), sec61-β (red fluorescence), DAPI (blue fluorescence), co-localization channel (yellow fluorescence). The AGPAT1-GFP-expressing cells were incubated with MitoTracker Red dye, fixed in 4% paraformaldehyde, and imaged as before. B, fluorescence images for AGPAT2-EGFP expressed in CHO cells. Cells for sec61-β, lamin A/C and mitochondria were processed as above. Shown for each image is a single z-stack image, whereas the x and y axis shows the z-stacks. Scale bar, 5 μm for larger images and 2 μm for higher magnification images.
FIGURE 3.
FIGURE 3.
Localization of human AGPAT1-EGFP and AGPAT2-EGFP to endoplasmic reticulum in mouse primary hepatocytes. A, mouse primary hepatocytes with exogenously expressed human AGPAT1-EGFP and human AGPAT2-EGFP were fixed in methanol and incubated with antibody calnexin (specific for endoplasmic reticulum) and imaged for green and red fluorescence using fluorescence microscopy. Shown are representative images for AGPAT1 and AGPAT2 (green fluorescence), calnexin (red fluorescence), DAPI (blue fluorescence), co-localization channel (yellow fluorescence), and the merged image. B, AGPAT1-EGFP- and AGPAT2-EGFP-expressing cells were incubated with MitoTracker Red dye, fixed in 4% paraformaldehyde, and imaged as before. Shown for each image is a single z-stack image, and the x and y axis shows the z-stacks. Scale bar, 5 μm.
FIGURE 4.
FIGURE 4.
Localization of human AGPAT1-RED and human AGPAT2-EGFP to endo-membranes in cultured cells. CHO cells overexpressing AGPAT2-EGFP were transfected with AGPAT1-RED and were fixed in methanol, stained with DAPI, and imaged for green and red fluorescence using fluorescence microscopy. Shown are representative images for AGPAT2 (green fluorescence), AGPAT1 (red fluorescence), DAPI (blue fluorescence), co-localization channel (yellow fluorescence), and the merged image. Shown for each image is a single z-stack image, and the x and y axis shows the z-stacks. Scale bar, 5 μm for larger images and 2 μm for higher magnification images.
FIGURE 5.
FIGURE 5.
Enzymatic activity and Western blot of wild type human AGPAT1 and AGPAT2 expressed in AD293 cells. A and B, Western blot for the recombinant AGPAT1 and AGPAT2 proteins from whole cell lysate probed with antibody specific for AGPAT1 and AGPAT2 protein. Lysates from cells infected with recombinant β-galactosidase (LacZ) adenovirus were loaded as a negative control. The same blot was stripped and reprobed with full form GAPDH antibody to demonstrate protein loading. C, AGPAT activity in whole cell lysate for AGPAT1 and AGPAT2 as determined by conversion of [3H]LPA to [3H]PA in the presence of oleoyl-CoA and expressed as product [3H]PA formed (nmol per min per mg of protein). The LPA to PA conversion by recombinant LacZ adenovirus was used as a control. Not shown is the conversion of substrate in the absence of enzyme. Each bar represents mean ± S.D. from three independent experiments carried out in triplicate. p value is shown above the bars.
FIGURE 6.
FIGURE 6.
Acyl-CoA and LPA specificity of recombinant human AGPAT1 and AGPAT2 expressed in AD293 cells. Specificity of human recombinant AGPAT1 (A) and AGPAT2 (C) for acyl-CoA donors was determined using sn-1-oleoyl-lysophosphatidic acid as an acceptor and various short, medium, and long chain fatty acyl-CoA as donors. The enzymatic activity is also compared with C18:1 = 100%, which is shown across the graph as a broken line. Specificity of human recombinant AGPAT1 (B) and AGPAT2 (D) for various species of sn-1-lysophosphatidic acid acceptors was determined using radioactive C18:1 as donor. Activities are expressed as product [3H]PA formed (nmol per min per mg protein). Shown is the 100 and 50% enzymatic activity when compared with C18:1 = 100%. All enzymatic activities were determined in two independent experiments in triplicate. Shown are the means from individual experiments, and each bar represents the mean of two experiments.
FIGURE 7.
FIGURE 7.
Homology modeling of human AGPAT1 and AGPAT2 proteins. Model for human AGPAT1, with LPA 18:1 manually docked (A), close up of LPA 18:1 bound (B), acyl-CoA 18:1 manually docked (C), and close up of acyl-CoA 18:1 bound (D). In the same fashion, the model of AGPAT2 is presented in E–H. The green cluster represents the highly conserved residues that bind the charged regions of the ligands. The blue cluster represents a hydrophobic tunnel that is capable of accommodating acyl chains. The length of the tunnel is ∼19 Å. The red cluster is composed of the conserved catalytic region, H(X)4D. The models clearly show the convergence of the acyl binding pocket and the active site.
FIGURE 8.
FIGURE 8.
Primary and secondary structure alignment of human AGPAT1 and AGPAT2. Shown are the primary structure alignments of human AGPAT1 (NP_006402.1) and AGPAT2 (CAH71722.1) and squash GPAT (C. moscata BAB17755.1). The secondary structure above the sequences corresponds to that of the AGPAT proteins. α-Helices are colored red; β-sheets are in yellow, and black lines represent coils. The amino acids identified by homology modeling in the hydrophobic tunnel are shown with asterisk. Underlined in green is the catalytic site, with the histidine and aspartate highly conserved amino acids. Underlined in magenta is the EGTR conserved region, with the highly conserved glycine also in the GPAT sequence. These two regions and other highly conserved amino acids were used to establish the homology modeling.
FIGURE 9.
FIGURE 9.
Liver acyltransferase activity and liver plasma triglyceride, cholesterol, glucose, insulin, lysophosphaditic acid, and phosphatidic acid levels after acute expression of human AGPAT2 and human AGPAT1 in the livers of Agpat2−/−. Groups of 8–15 mice of either wild type or Agpat2−/− genotype were infected with the recombinant adenovirus expressing AGPAT2 and sacrificed 1 week later. A shows a PCR amplification of the human AGPAT2 and mouse GAPDH transcripts. B–F show the liver AGPAT activity, liver weight, triglyceride, lysophosphaditic acid, and phosphatidic acid levels (phospholipids were analyzed in groups of six mice). G–I show plasma glucose, triglyceride, and insulin levels. J–R show PCR amplification and liver and plasma levels after infecting Agpat2−/− mice with recombinant adenovirus expressing AGPAT1. N.D., not determined. The p values are shown above the bars (*, < 0.0001; **, < 0.001; †, < 0.01; ‡, < 0.05).
FIGURE 10.
FIGURE 10.
Western blot of human AGPAT1 and AGPAT2 in endoplasmic reticulum of mouse livers. A and B, Western blot for the recombinant AGPAT1 and AGPAT2 proteins from ER probed with antibody specific for AGPAT1 and AGPAT2 protein. Lysates from cells infected with recombinant AGPAT1 and AGPAT2 adenovirus expressed in 293 cells were loaded as a positive control. The same blot was stripped and reprobed with calnexin antibody to demonstrate ER specificity.
FIGURE 11.
FIGURE 11.
Folding of the two highly conserved motifs found in glycerophospholipid acyltransferases. This picture of the model of AGPAT2 showing the relationship between a conserved stretch of amino acids (Glu172, Gly173, Thr174, and Arg175) in AGPAT2 that have been proposed to be related to ligand binding. Red is the catalytic site H(X)4D; green is related to the cluster that binds the charged portion of the ligands, and the blue surface is the hydrophobic tunnel that accommodates the acyl chain. By manually docking C18:1-LPA, we observed that Arg175 in AGPAT2 is likely related to binding of the charged portions of LPA. The other conserved amino acids (Glu172, Gly173, and Thr174) in this region are behind the catalytic residues away from ligand docking. The highly conserved Gly173 in AGPAT2 can be involved in the plasticity of the active site during catalysis.

References

    1. McMaster C. R., Jackson T. R. (2004) in Lipid Metabolism and Membrane Biogenesis (Daum G. ed) pp. 5–30, Springer-Verlag, Berlin
    1. Coleman R. A., Lee D. P. (2004) Prog. Lipid Res. 43, 134–176 - PubMed
    1. Leung D. W. (2001) Front. Biosci. 6, D944–D953 - PubMed
    1. Agarwal A. K., Garg A. (2003) Trends Endocrinol. Metab. 14, 214–221 - PubMed
    1. Takeuchi K., Reue K. (2009) Am. J. Physiol. Endocrinol. Metab. 296, E1195–E1209 - PMC - PubMed

Publication types

MeSH terms