Comparative Study
. 2011 Aug 28;17(9):1094-100.
doi: 10.1038/nm.2438.

Imatinib potentiates antitumor T cell responses in gastrointestinal stromal tumor through the inhibition of Ido

Affiliations
Comparative Study

Imatinib potentiates antitumor T cell responses in gastrointestinal stromal tumor through the inhibition of Ido

Vinod P Balachandran et al. Nat Med. .

Abstract

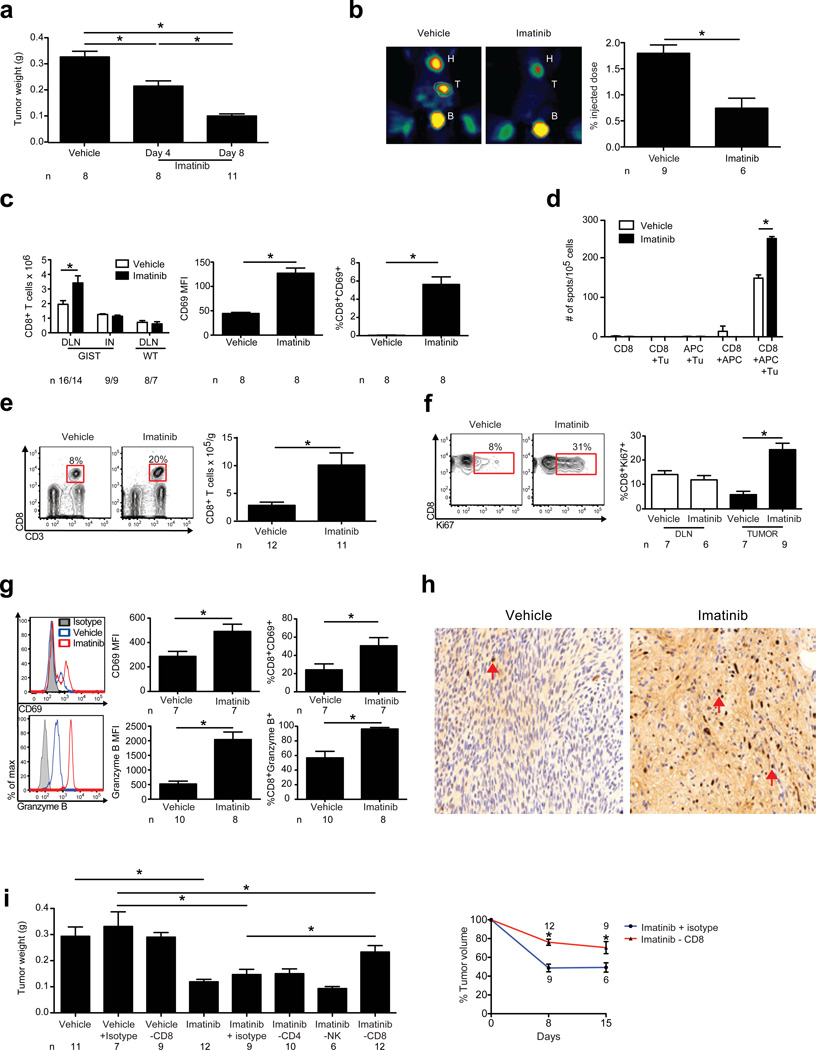
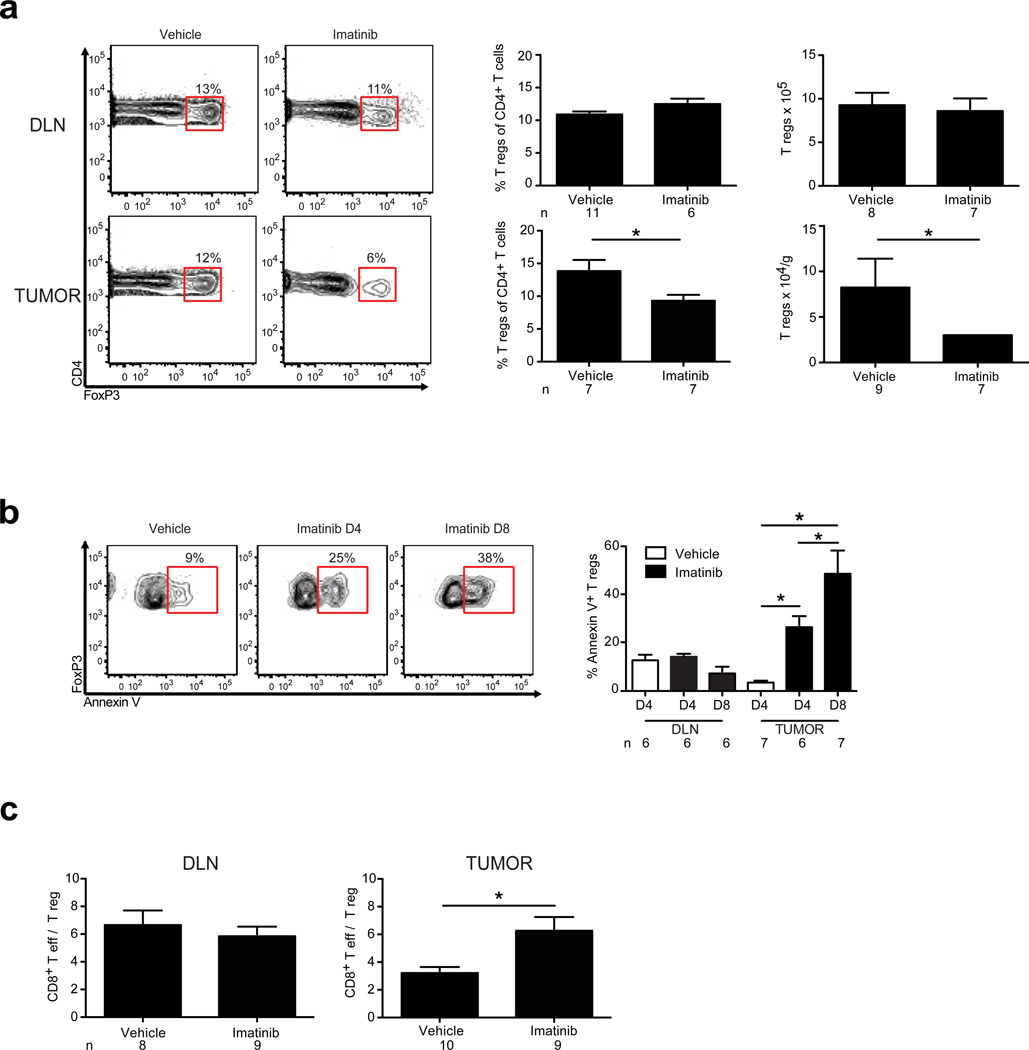
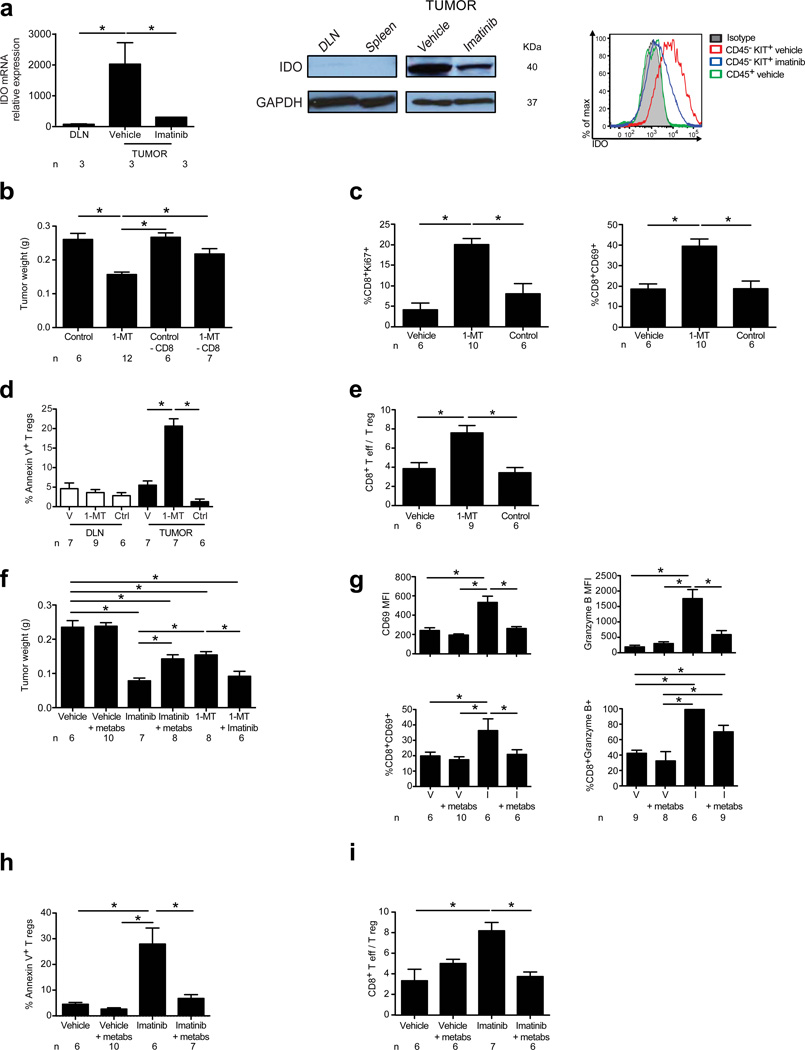
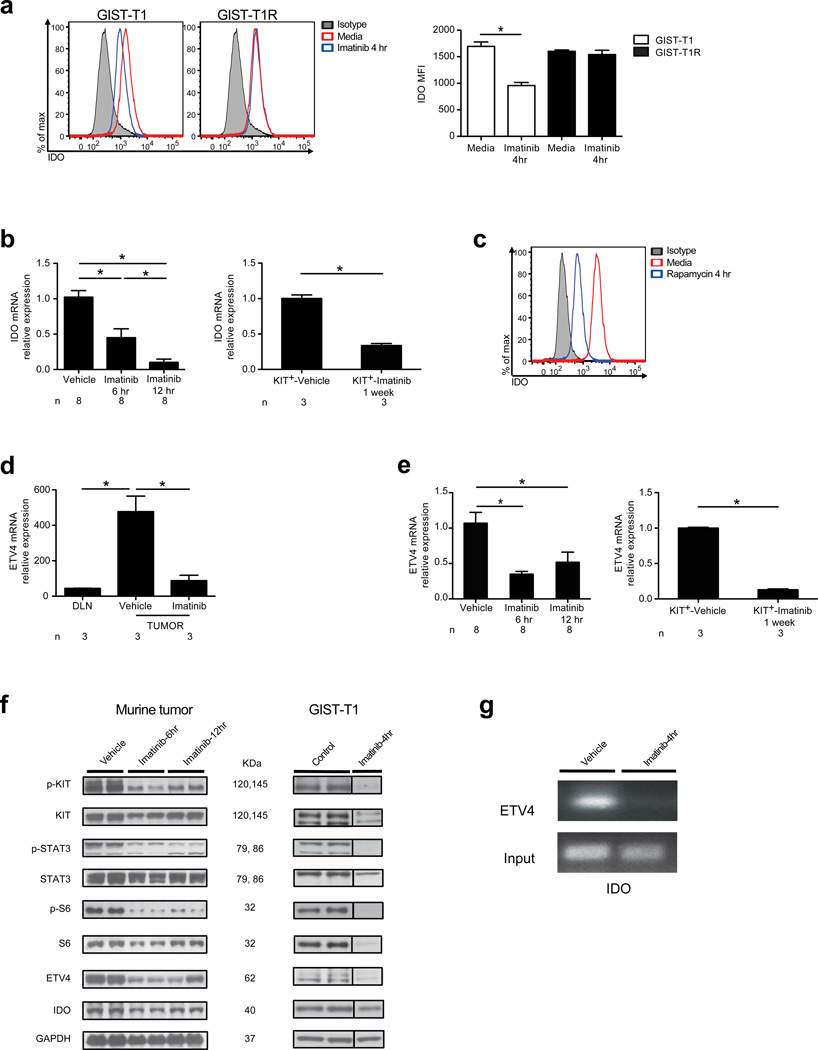
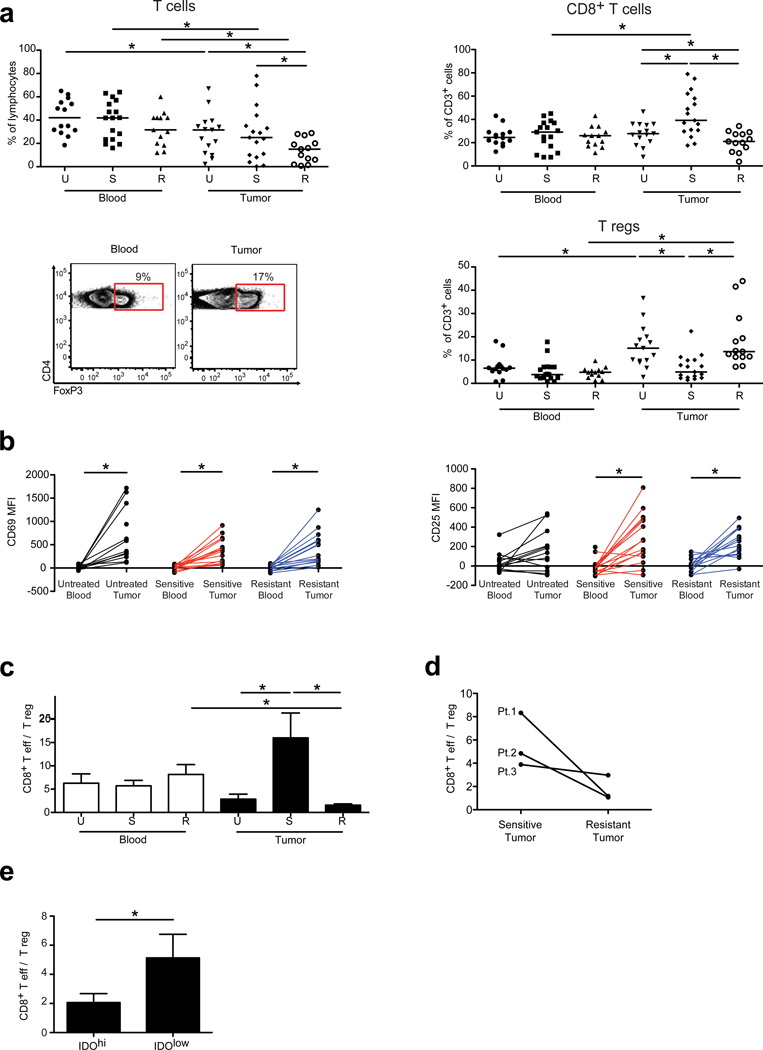
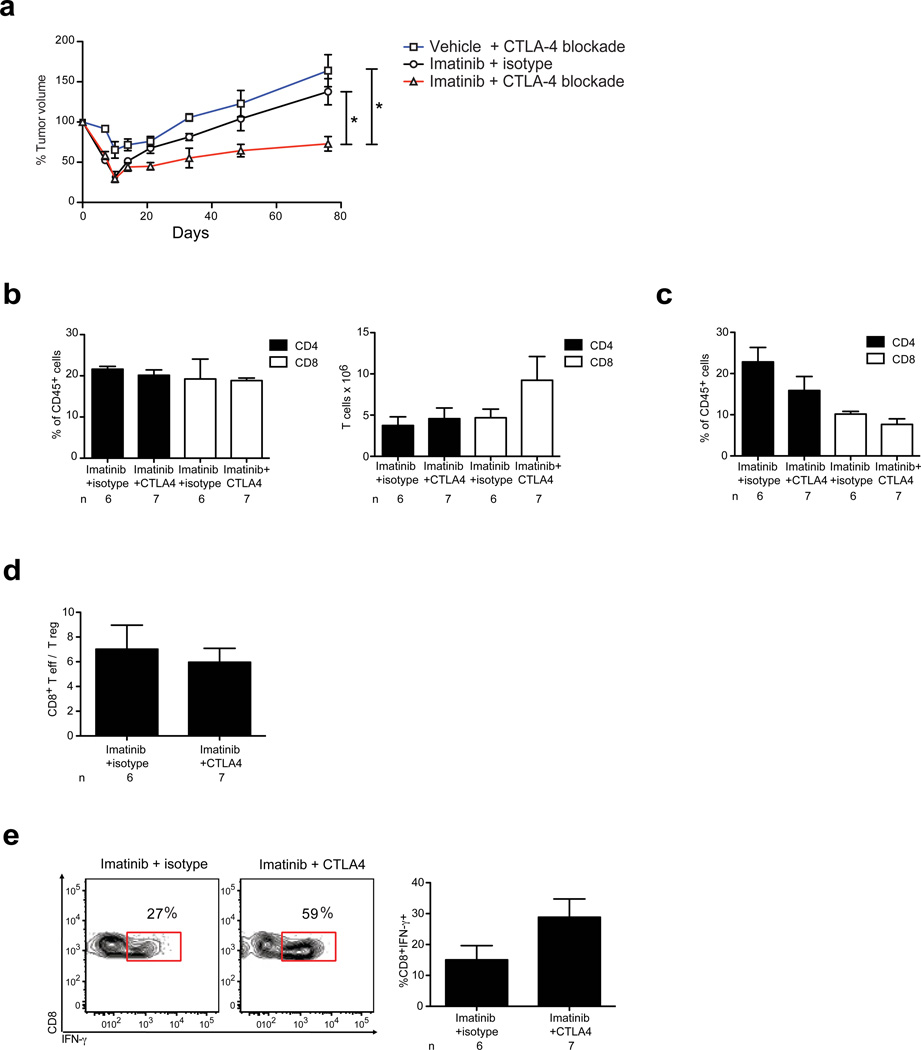
Imatinib mesylate targets mutated KIT oncoproteins in gastrointestinal stromal tumor (GIST) and produces a clinical response in 80% of patients. The mechanism is believed to depend predominantly on the inhibition of KIT-driven signals for tumor-cell survival and proliferation. Using a mouse model of spontaneous GIST, we found that the immune system contributes substantially to the antitumor effects of imatinib. Imatinib therapy activated CD8(+) T cells and induced regulatory T cell (T(reg) cell) apoptosis within the tumor by reducing tumor-cell expression of the immunosuppressive enzyme indoleamine 2,3-dioxygenase (Ido). Concurrent immunotherapy augmented the efficacy of imatinib in mouse GIST. In freshly obtained human GIST specimens, the T cell profile correlated with imatinib sensitivity and IDO expression. Thus, T cells are crucial to the antitumor effects of imatinib in GIST, and concomitant immunotherapy may further improve outcomes in human cancers treated with targeted agents.


Figures

Figure 1
Figure 1. CD8+ T cells contribute to anti-tumor effects of imatinib
GIST and WT mice were treated with vehicle or imatinib and analyzed on days 4 (a) or 8 (a–i) using flow cytometry, PET, and IHC. (a) Tumor weight. (b) Tumor uptake of 18FDG by PET. Heart (H), tumor (T), and bladder (B) are indicated. (c) Number of CD8+ T cells in the DLN and inguinal node (IN) of GIST mice and mesenteric node of WT mice. Mean fluorescence intensity (MFI), and frequency of CD8+CD69+ T cells in the DLN of GIST mice. (d) Purified DLN CD8+ T cells from treated GIST mice were cultured with T cell-depleted splenocytes (APC) and tumor cells (Tu). IFN-γ secretion was determined by ELISPOT. Average spots per well ± s.e.m. (n = 3 wells) are shown and represent two independent experiments. (e) Gating of CD8+ T cells as a frequency of CD45+ lymphocytes (left). Absolute number of intratumoral CD8+ T cells (right). (f) Gating and frequency of intratumoral CD8+Ki67+ T cells. (g) Histograms, MFI, and frequency of intratumoral CD8+CD69+ and CD8+granzyme B+ T cells. (h) Tumors were stained for CD8 (arrows). (i) GIST mice were depleted of CD8+ or CD4+ T cells or NK cells during 1 week of imatinib treatment and tumors were weighed (left panel) or during 2 weeks of treatment and measured with magnetic resonance imaging (right panel). Data in (a–g, and i) represent means ± s.e.m. with n ≥ 6 per group. *P < 0.05.
Figure 2
Figure 2. Imatinib induces T reg apoptosis selectively within the tumor
GIST mice were treated with vehicle or imatinib and analyzed by flow cytometry on day 4 (D4) or day 8 (D8). (a) Representative gating, frequency, and absolute numbers of DLN and intratumoral T regs on day 8. (b) Contour plots demonstrate representative gating of Annexin V expression on intratumoral T regs (CD4+FoxP3+). Bar graphs represent frequency of Annexin V+ T regs in the DLN and tumor. Loss of T reg viability was confirmed using propidium iodide staining. (c) CD8+ T cell to T reg ratio in the DLN and tumor on day 8. Data represent means ± s.e.m. with n = 6–11 per group. *P < 0.05.
Figure 3
Figure 3. Imatinib alters intratumoral T cells through inhibition of Ido
(a) Ido mRNA in the DLN and tumor as determined by microarray analysis of vehicle treated GIST mice and the tumor from imatinib treated GIST mice after 7 days (left panel, n = 3 per group). Western blot (WB) staining for Ido in the DLN, spleen (center panel, left half), and tumor of vehicle treated GIST mice and tumor of imatinib treated GIST mice (center panel, right half). Intracellular Ido expression in CD45+ intratumoral immune cells and CD45Kit+ tumor cells as determined by flow cytometry (right panel). (b) Tumor weight of GIST mice treated with 1-MT for 7 d with or without CD8+ T cell depletion. (c–i) GIST mice were treated for 7 d with combinations of 1-MT or control (Ctrl), imatinib (I), or vehicle (V), and tryptophan metabolites (metabs). Tumors and DLNs were analyzed using flow cytometry. (c) Frequency of intratumoral CD8+Ki67+ and CD8+CD69+ T cells. (d) Frequency of intratumoral Annexin V+ T regs. (e) Intratumoral CD8+ T cell to T reg ratio. (f) Tumor weight. (g) MFI and frequency of intratumoral CD8+CD69+ and CD8+granzyme B+ T cells. (h) Frequency of intratumoral Annexin V+ T regs. (i) Intratumoral CD8+ T cell to T reg ratio. Data in (a) left panel represent means ± s.e.m. and are shown relative to internal controls (housekeeping gene). Data represent means ± s.e.m. with n = 6–12 per group. *P < 0.05.
Figure 4
Figure 4. Imatinib reduces IDO expression through inhibition of oncogenic KIT signaling
(a) IDO in GIST-T1 and GIST-T1R cells. (b) Ido mRNA in mouse GIST tumors (left panel, n = 8 per group) and sorted Kit+ tumor cells (right panel, n = 3 per group shown relative to internal controls) after treatment with vehicle or imatinib. (c) Intracellular IDO in GIST-T1 cells after culture in rapamycin. (d) Etv4 mRNA in the DLN and tumor determined by microarray analysis from GIST mice after vehicle or imatinib treatment for 7 d. n = 3 per group shown relative to internal controls. (e) Etv4 mRNA in mouse GIST tumors (left panel, n = 8 per group) and sorted Kit+ tumor cells (right panel, n = 3 per group) after treatment with vehicle or imatinib. (f) WB of KIT, ETV4, and IDO in GIST mice (left panel) and GIST-T1 cells (right panel) after treatment with vehicle, control, or imatinib. Both phosphorylated and non-phosphorylated KIT, STAT3, and S6 are shown as components of oncogenic KIT signaling. IDO in GIST-T1 cells was detected via immunoprecipitation. (g) Chromatin immunoprecipitation (ChIP) was performed on GIST mice treated with vehicle or imatinib in vivo (n = 3 per group). In vitro culture experiments were performed with 1 µM imatinib. Data in (b) and (e) were normalized to internal controls and are shown relative to vehicle treatment. Data represent means ± s.e.m. with n as indicated above, or triplicate wells analyzed individually and representative plots are shown. *P < 0.05.
Figure 5
Figure 5. Intratumoral CD8+ T cell to T reg ratio correlates with imatinib sensitivity in human GIST
(a) Flow cytometrically determined frequency of CD3+ and CD8+ T cells and T regs in peripheral blood and tumor of untreated (U; n = 15), sensitive (S; n = 17), and resistant (R; n = 13) GIST specimens and representative gating for T regs. (b) CD69 and CD25 expression on CD8+ T cells from matched peripheral blood and tumor samples. (c) CD8+ T cell to T reg ratio in blood and tumor. (d) CD8+ T cell to T reg ratio in 3 patients (Pt.) who underwent synchronous resection of a sensitive and resistant tumor. (e) CD8+ T cell to T reg ratio in tumors expressing low (< 4,000 MFI, n = 6) or hi (≥ 4,000, n = 7) IDO protein as determined by flow cytometry. Data in (c,e) represent means ± s.e.m. *P < 0.05.
Figure 6
Figure 6. CTLA-4 blockade is synergistic with imatinib
GIST mice were treated with imatinib or vehicle for 7 d with or without induction CTLA-4 blockade or isotype control antibody followed by chronic CTLA-4 blockade. (a) Tumor size was monitored using serial MRIs. (b–e) Tumors and DLNs of GIST mice were analyzed on days 16–18 to determine (b) frequency and absolute number of CD4+ and CD8+ T cells in DLN, (c) frequency of intratumoral CD4+ and CD8+ T cells, and (d) intratumoral CD8+ T cell to T reg ratio. (e) Intratumoral CD8+ T cells were stimulated for 4 h with phorbol 12-myristate 13-acetate and ionomycin followed by intracellular analysis for IFN-γ production; P = 0.09, two-tailed student t-test. Data in (a) represent means ± s.e.m. of a composite of two independent experiments each with 3–5 mice per group. Data in (b–e) represent means ± s.e.m. with n = 6–8 per group. *P < 0.05.

Comment in

References

    1. Rubin BP, Heinrich MC, Corless CL. Gastrointestinal stromal tumour. Lancet. 2007;369:1731–1741. - PubMed
    1. Hirota S, et al. Gain-of-function mutations of c-kit in human gastrointestinal stromal tumors. Science. 1998;279:577–580. - PubMed
    1. Heinrich MC, et al. PDGFRA activating mutations in gastrointestinal stromal tumors. Science. 2003;299:708–710. - PubMed
    1. Demetri GD, et al. Efficacy and safety of imatinib mesylate in advanced gastrointestinal stromal tumors. N Engl J Med. 2002;347:472–480. - PubMed
    1. Blanke CD, et al. Phase III randomized, intergroup trial assessing imatinib mesylate at two dose levels in patients with unresectable or metastatic gastrointestinal stromal tumors expressing the kit receptor tyrosine kinase: S0033. J Clin Oncol. 2008;26:626–632. - PubMed

Publication types

MeSH terms