. 2011 Aug 28;13(10):1265-71.
doi: 10.1038/ncb2327.

Formation of stable attachments between kinetochores and microtubules depends on the B56-PP2A phosphatase

Affiliations

Formation of stable attachments between kinetochores and microtubules depends on the B56-PP2A phosphatase

Emily A Foley et al. Nat Cell Biol. .

Abstract

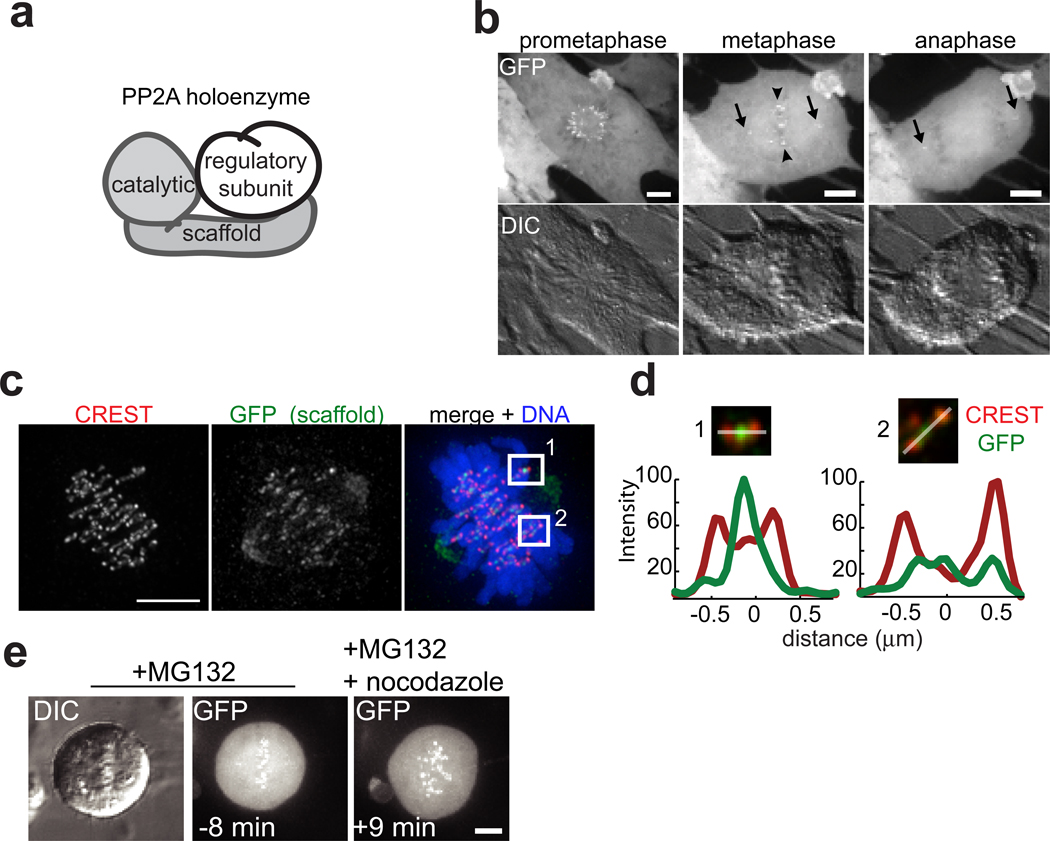
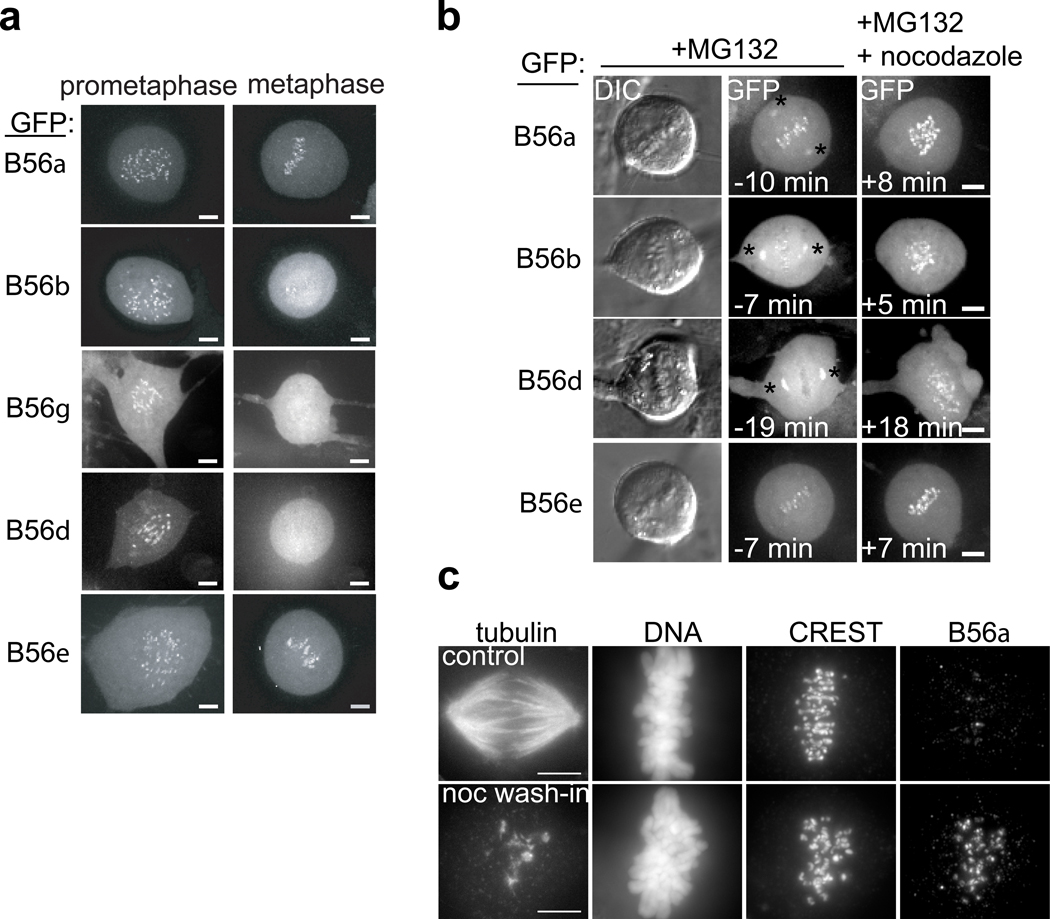
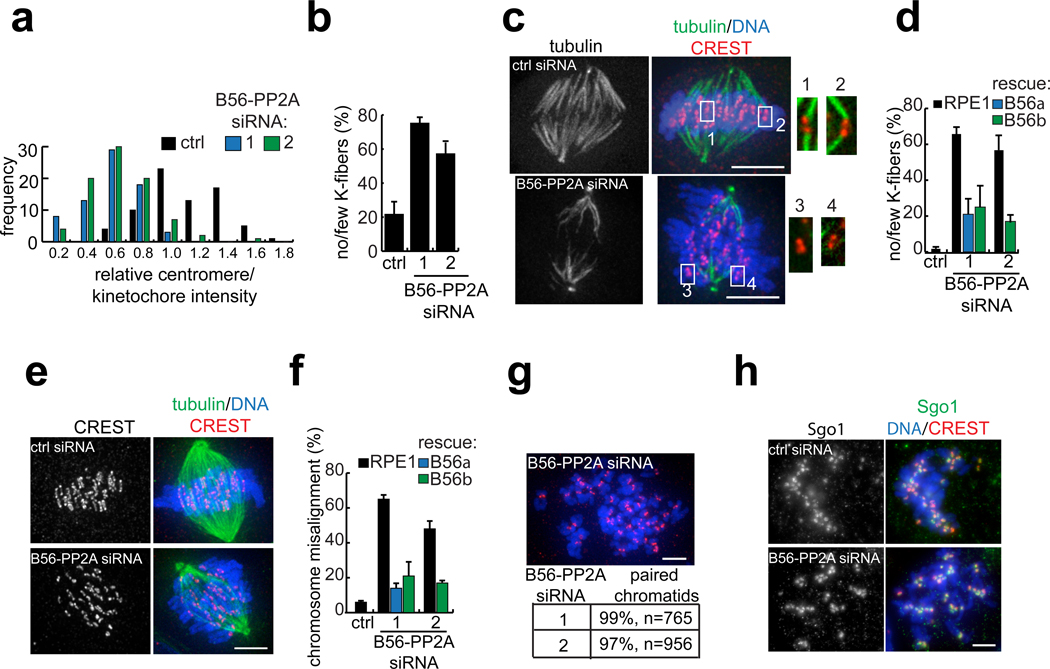
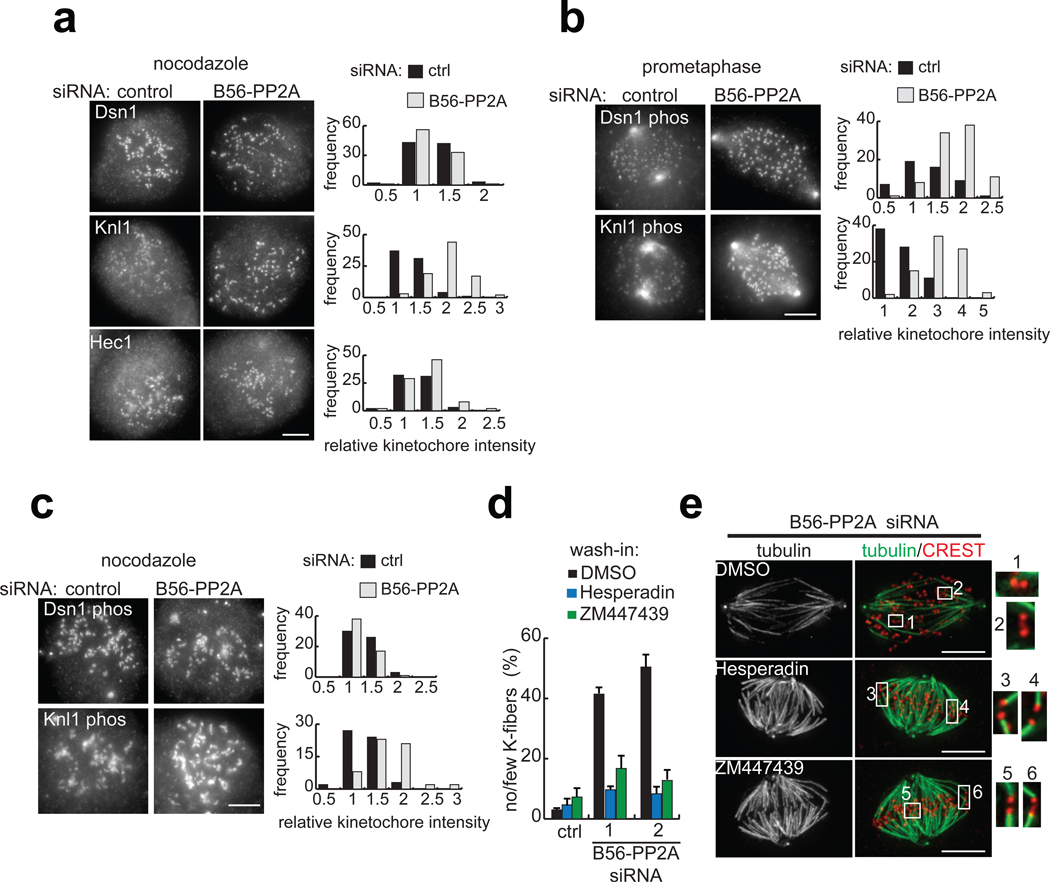
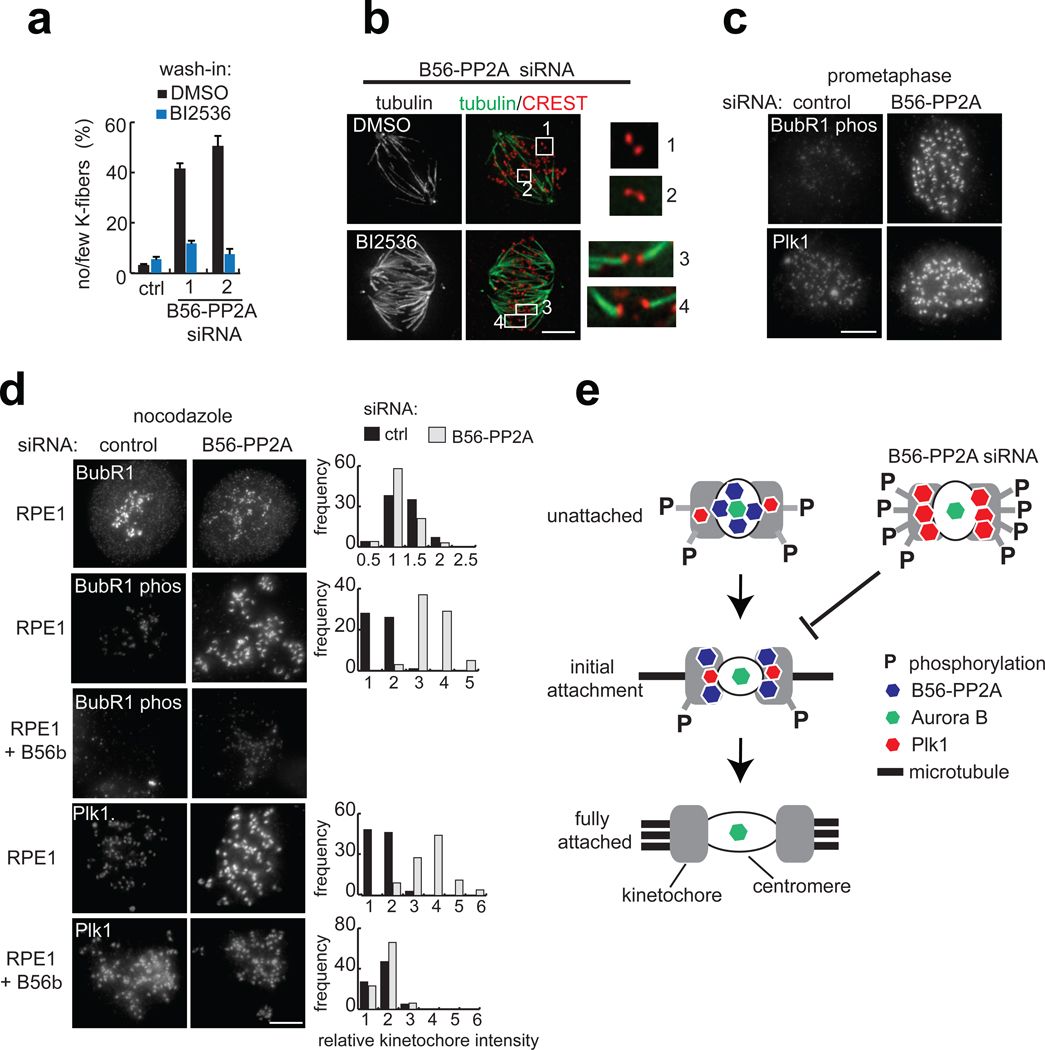
Error-free chromosome segregation depends on the precise regulation of phosphorylation to stabilize kinetochore-microtubule attachments (K-fibres) on sister chromatids that have attached to opposite spindle poles (bi-oriented). In many instances, phosphorylation correlates with K-fibre destabilization. Consistent with this, multiple kinases, including Aurora B and Plk1, are enriched at kinetochores of mal-oriented chromosomes when compared with bi-oriented chromosomes, which have stable attachments. Paradoxically, however, these kinases also target to prometaphase chromosomes that have not yet established spindle attachments and it is therefore unclear how kinetochore-microtubule interactions can be stabilized when kinase levels are high. Here we show that the generation of stable K-fibres depends on the B56-PP2A phosphatase, which is enriched at centromeres/kinetochores of unattached chromosomes. When B56-PP2A is depleted, K-fibres are destabilized and chromosomes fail to align at the spindle equator. Strikingly, B56-PP2A depletion increases the level of phosphorylation of Aurora B and Plk1 kinetochore substrates as well as Plk1 recruitment to kinetochores. Consistent with increased substrate phosphorylation, we find that chemical inhibition of Aurora or Plk1 restores K-fibres in B56-PP2A-depleted cells. Our findings reveal that PP2A, an essential tumour suppressor, tunes the balance of phosphorylation to promote chromosome-spindle interactions during cell division.


Figures

Figure 1
Figure 1
Microtubule-sensitive targeting PP2A to centromeres/kinetochores during cell division. (a) Schematic showing PP2A’s scaffold, catalytic, and regulatory subunits. (b) Maximum intensity confocal projections show distributions of GFP-scaffold expressed in an RPE1 cell at mitosis (top). Centrosome (arrow) and centromere (arrowhead) localizations are indicated. DIC images (below) show chromosomes in same cell. (c) Immunofluorescence images of a maximum intensity projection of an RPE1 cell expressing GFP-scaffold fixed and stained for kinetochores (CREST, red), GFP (green) and DNA (blue, only shown in overlay). (d) Maximum intensity projection of the optical sections spanning the boxed regions in (c) enlarged 2x with DNA omitted. Plotted is the intensity profile of the CREST (red) and GFP (green) signal measured along a line (white) drawn across the centromere. (e) Maximum intensity confocal projections of GFP-scaffold distribution and chromosomes (DIC) in a cell arrested in metaphase (10 µM MG132), and imaged live at the indicated times relative to addition of nocodazole (3.2 µM, time zero). Scale bars, 5 µm.
Figure 2
Figure 2
Microtubule-sensitive targeting of B56 regulatory subunits to centromeres/kinetochores. (a) Maximum intensity confocal projections show distributions of GFP in different cell lines stably expressing GFP-B56α-ε proteins. (b) RPE1 cells stably expressing a GFP-fusion of the indicated B56 regulatory subunit were arrested in metaphase (10 µM MG132) and imaged live before and after addition of nocodazole (3.2 µM, time zero). Maximum intensity confocal projections show GFP distribution, and DIC images show chromosomes before nocodazole addition. Spindle pole targeting was observed in MG132-arrested cells (asterisk). (c) Cells in MG132 (10 µM) were treated with nocodazole (3.2 µM, bottom) or control solvent (DMSO, top) for 5 min and processed for immunofluorescence. Equivalently scaled maximum intensity projections of tubulin, DNA, kinetochores (CREST), and B56α staining are shown. Scale bars, 5 µm.
Figure 3
Figure 3
B56-PP2A is required for stable kinetochore-microtubule attachments and chromosome alignment. (a) Analysis of GFP-scaffold levels at centromeres/kinetochores after B56-PP2A siRNA. An RPE1 cell line expressing GFP-scaffold was transfected with control or either of two B56-PP2A siRNA pools (1, 2) and treated with nocodazole (3.2 µM, 60 min) before processing for immunofluorescence. The GFP signal at centromeres/kinetochores was measured, processed, and normalized to the average value in cells treated with control siRNA. An intensity distribution histogram is plotted from one experiment. B56-PP2A siRNA reduced scaffold targeting to 0.52 ± 0.05 (pool 1) or 0.55 ± 0.05 (pool 2) relative to control cells (mean ± s.e.m, 4 experiments, >50 centromeres/kinetochores from 5 cells per condition, per time). (b–d) K-fiber defects in B56-PP2A siRNA cells. (b) The frequency of pre-anaphase mitotic cells with few or no K-fibers is shown. (c–d) Rescue of siRNA phenotype by stable over-expression of siRNA-resistant B56α or B56β. Cells were arrested in mitosis with nocodazole (0.32 µM, 2.5 h) and released into MG132 (10 µM, 40 min) before cold-treatment and fixation. (c) Cold-stable microtubules in a control and B56-PP2A (pool 2) siRNA treated cell. Insets show 2x enlargement of the boxed regions. (d) The frequency of K-fiber defects is shown. (e–f) Chromosome alignment defects in B56-PP2A siRNA cells. Control or B56-PP2A siRNA-treated cells were arrested with MG132 (10 µM, 60 min). (e) Example of chromosome alignment defects in B56-PP2A (pool 2) treated cells versus control cells. (f) The frequency of mitotic cells with misaligned chromosomes is shown. (g) Cohesion is preserved in B56-PP2A siRNA cells. Chromosome spreads were prepared from nocodazole-arrested cells (3.2 µM, 4 h) treated with either of two B56-PP2A siRNA pools. The fraction of paired chromatids from two experiments is shown. (h) Chromosome spreads were prepared from control and B56-PP2A (pool 2) siRNA treated RPE1 cells arrested as in (g). Equivalently scaled Sgo1 images and an overlay with DNA and kinetochores are shown. Images show maximum intensity projections with tubulin or Sgo1 (green), DNA (blue) and kinetochores (CREST, red). Scale bars, 5 µm. Bars show mean ± s.e.m. (n=3 experiments, >80 cells per condition per time).
Figure 4
Figure 4
B56-PP2A depletion increases the phosphorylation of Aurora B substrates and Aurora inhibition suppresses the B56-PP2A siRNA phenotype. (a–c) RPE1 cells were transfected with control or B56-PP2A siRNA (pool 2) and (a, c) incubated with nocodazole (3.2 µM, 60 min) before fixation, or (b) fixed, and stained using indicated antibodies. Images are maximum intensity projections with equivalent scaling. The signal at kinetochores was measured, processed, and normalized to the average value in control siRNA cells. Histograms show intensity distributions from one experiment. (a) KMN network targeting is preserved in B56-PP2A siRNA cells. In B56-PP2A siRNA cells, the mean kinetochore staining intensities were calculated for Dsn1 (0.85 ± 0.11), Knl1 (1.41 ± 0.23), and Hec1 (1.05 ± 0.08) relative to control cells (n=2–3 experiments, >75 kinetochores from 5 cells per condition, per time). (b–c) Analysis of Aurora B substrate phosphorylation. (b) In prometaphase cells, kinetochores with an inter-kinetochore stretch of 1.2 to 1.5 µM were analyzed. In B56-PP2A siRNA cells, the mean phosho-Dsn1 and phospho-Knl1 intensity was 1.79 ± 0.32 and 2.26 ± 0.07, respectively (n=2 experiments, >50 kinetochores from 5 cells per condition, per time). (c) In nocodazole-treated B56-PP2A siRNA cells, the mean intensity of phospho-Dsn1 and phospho-Knl1 was 1.03 ± 0.13 and 1.21 ± 0.15, respectively, relative to control cells (3 experiments, >60 kinetochores from 5 cells per condition per experiment). (d–e) RPE1 cells treated with control or either of two pools of B56-PP2A siRNA (1, 2) were incubated in MG132 (10 µm, 15 min), followed by addition of Hesperadin (50 nM) or ZM447439 (1 µM) or control solvent (DMSO) for 45 min. (d) The frequency of mitotic cells with few or no cold-stable K-fibers is plotted (n=3 experiments, >80 cells per condition per time). (e) Maximum intensity projection of tubulin (green) and an overlay with kinetochores (CREST, red) in B56-PP2A siRNA (pool 2) cells treated with indicated inhibitor. Insets are 2x enlargement of the optical sections spanning the boxed regions. Scale bars, 5 µm. Mean ± s.e.m provided.
Figure 5
Figure 5
B56-PP2A regulates Plk1 substrate phosphorylation and Plk1 targeting to the kinetochore, and Plk1 inhibition suppresses the B56-PP2A siRNA phenotype. (a–b) RPE1 cells transfected with control or either of two B56-PP2A siRNA pools (1, 2) were incubated in MG132 (10 µM, 15 min), followed by addition of BI2536 (40 nM) or DMSO for 45 min. (a) The frequency of mitotic cells with few or absent cold-stable K-fibers is plotted (n=3 experiments, >80 cells per condition per time). (b) Maximum intensity projection of tubulin (green) and an overlay with kinetochores (CREST, red) in B56-PP2A siRNA (pool 2) cells treated with DMSO or BI2536 (40 nM). Insets are 3x enlargement of the optical sections spanning the boxed centromeres. (c) RPE1 cells transfected with control or B56-PP2A siRNA (pool2) were fixed and stained. Maximum intensity projections with equivalent scaling are shown. (d) RPE1 cells or a cell line expressing siRNA-resistant B56β were transfected with control or B56-PP2A (pool2) siRNA and incubated with nocodazole (3.2 µM, 60 min) before processing for immunofluorescence. The signal at kinetochores was measured, processed, and normalized to the average value in control siRNA cells. Histograms show intensity distributions from one experiment. In B56-PP2A siRNA cells, mean kinetochore intensity for BubR1 (0.84 ± 0.24), phospho-BubR1 (3.54 ± 1.41), and Plk1 (2.57 ± 0.32) were calculated relative to control cells (n=3–6 experiments, >60 kinetochores from five cells per condition, per time). In the cell line over-expressing siRNA resistant B56β, Plk1 targeting was similar after B56-PP2A siRNA (1.08 ± 0.12) or control siRNA (0.97 ± 0.11), relative to RPE1 cells treated with control siRNA (n=3 experiments, >60 kinetochores from five cells per condition, per time). Scale bars, 5 µm. Mean ± s.e.m provided. (e) Schematic shows a model for how B56-PP2A localization to centromeres (white circle) and kinetochores (grey) may promote microtubule binding.

References

    1. Musacchio A, Salmon ED. The spindle-assembly checkpoint in space and time. Nat Rev Mol Cell Biol. 2007;8:379–393. - PubMed
    1. Ahonen LJ, et al. Polo-like kinase 1 creates the tension-sensing 3F3/2 phosphoepitope and modulates the association of spindle-checkpoint proteins at kinetochores. Curr Biol. 2005;15:1078–1089. - PubMed
    1. Cheeseman IM, et al. Phospho-regulation of kinetochore-microtubule attachments by the Aurora kinase Ipl1p. Cell. 2002;111:163–172. - PubMed
    1. Lampson MA, Renduchitala K, Khodjakov A, Kapoor TM. Correcting improper chromosome-spindle attachments during cell division. Nat Cell Biol. 2004;6:232–237. - PubMed
    1. Pinsky BA, Kung C, Shokat KM, Biggins S. The Ipl1-Aurora protein kinase activates the spindle checkpoint by creating unattached kinetochores. Nat Cell Biol. 2006;8:78–83. - PubMed

Materials and Methods References

    1. Welburn JP, et al. Aurora B phosphorylates spatially distinct targets to differentially regulate the kinetochore-microtubule interface. Mol Cell. 2010;38:383–392. - PMC - PubMed
    1. Elowe S, Hummer S, Uldschmid A, Li X, Nigg EA. Tension-sensitive Plk1 phosphorylation on BubR1 regulates the stability of kinetochore microtubule interactions. Genes Dev. 2007;21:2205–2219. - PMC - PubMed
    1. Kline SL, Cheeseman IM, Hori T, Fukagawa T, Desai A. The human Mis12 complex is required for kinetochore assembly and proper chromosome segregation. J Cell Biol. 2006;173:9–17. - PMC - PubMed
    1. Tang Z, et al. PP2A is required for centromeric localization of Sgo1 and proper chromosome segregation. Dev Cell. 2006;10:575–585. - PubMed
    1. Hoffman DB, Pearson CG, Yen TJ, Howell BJ, Salmon ED. Microtubule-dependent changes in assembly of microtubule motor proteins and mitotic spindle checkpoint proteins at PtK1 kinetochores. Mol Biol Cell. 2001;12:1995–2009. - PMC - PubMed

Publication types

MeSH terms

Substances