. 2011 Aug 28;14(10):1345-51.
doi: 10.1038/nn.2900.

Neuronal activity modifies the DNA methylation landscape in the adult brain

Affiliations

Neuronal activity modifies the DNA methylation landscape in the adult brain

Junjie U Guo et al. Nat Neurosci. .

Abstract

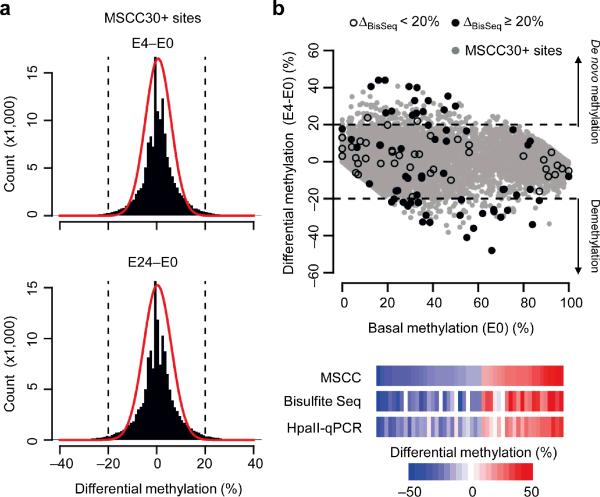
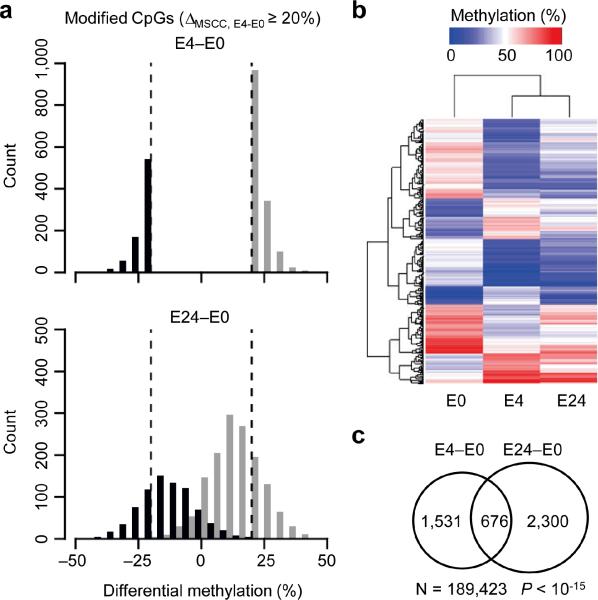
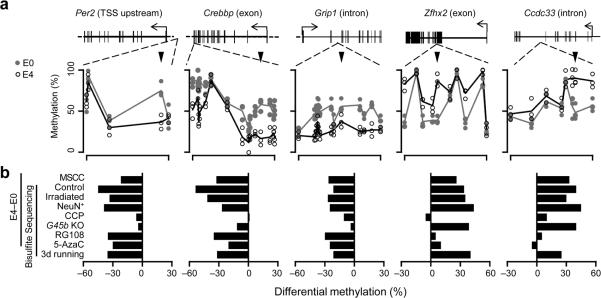
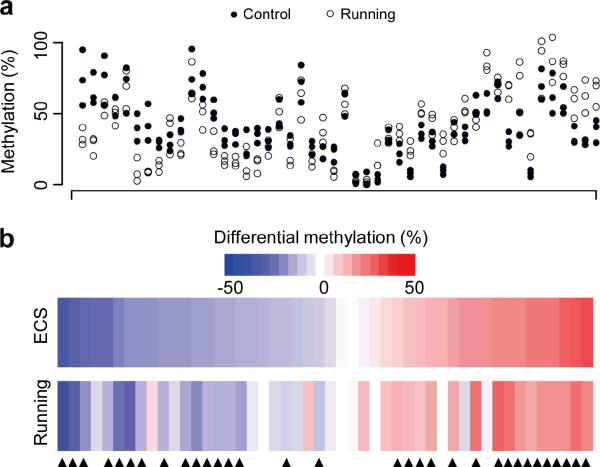
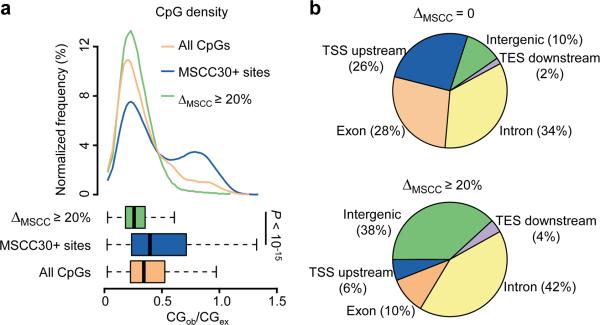
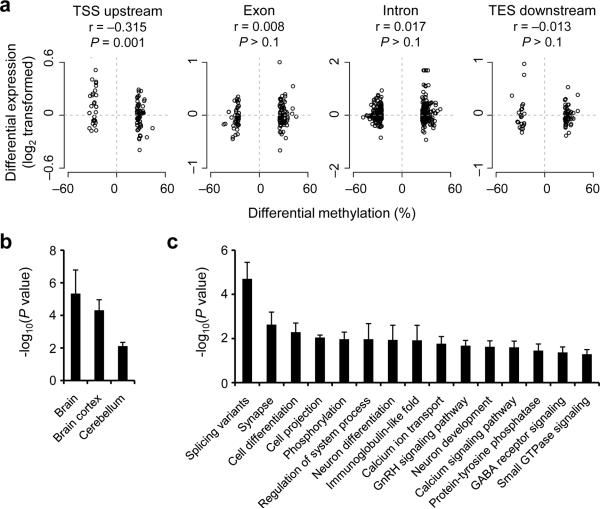
DNA methylation has been traditionally viewed as a highly stable epigenetic mark in postmitotic cells. However, postnatal brains appear to show stimulus-induced methylation changes, at least in a few identified CpG dinucleotides. How extensively the neuronal DNA methylome is regulated by neuronal activity is unknown. Using a next-generation sequencing-based method for genome-wide analysis at single-nucleotide resolution, we quantitatively compared the CpG methylation landscape of adult mouse dentate granule neurons in vivo before and after synchronous neuronal activation. About 1.4% of 219,991 CpGs measured showed rapid active demethylation or de novo methylation. Some modifications remained stable for at least 24 h. These activity-modified CpGs showed a broad genomic distribution with significant enrichment in low-CpG density regions, and were associated with brain-specific genes related to neuronal plasticity. Our study implicates modification of the neuronal DNA methylome as a previously underappreciated mechanism for activity-dependent epigenetic regulation in the adult nervous system.


Figures

Figure 1
Figure 1
Modification of DNA methylation landscape in the adult dentate gyrus by neuronal activity. (a) Comparison of CpG methylation profiles of the dentate gyrus of adult mice at different time points after a single ECS. Shown are histograms of differential CpG methylation between sham control and 4 hrs after ECS (ΔMSCC, E4-E0; top) and between sham control and 24 hrs after ECS (ΔMSCC, E24-E0; bottom). Red lines represent Gaussian distributions with the same means and variances. Dashed lines represent ± 20% cut-off. (b) A scatter plot of differential CpG methylation (E4-E0) at individual CpGs versus their basal methylation levels at E0 (MSCC estimates with 30+ reads; gray dots). Black dots indicate bisulfite analysis of selected MSCC sites for validation (solid: ΔBisSeq ≥ 20%; open: ΔBisSeq < 20%). Below are heat-maps of methylation changes detected by MSCC, bisulfite sequencing, and HpaII-qPCR, from independent biological samples.
Figure 2
Figure 2
Sustainability of activity-induced CpG modifications. (a) Histograms showing distributions of activity-modified CpGs (ΔMSCC;E4-E0 ≥ 20%) at E4 (top) and E24 (bottom). Note that de novo methylated (black) and demethylated (gray) CpGs remain well segregated from E0 at E24. (b) Unsupervised hierarchical clustering of methylation levels of top 500 MSCC sites with activity-induced modifications. Note that the E24 profile is more similar to E4 than to E0, suggesting that activity-induced CpG modifications in mature neurons in vivo are relatively sustained. (c) Venn diagram showing highly significant overlapping between activity-modified CpGs identified at E4 and E24. Note that fewer MSCC sites (N) are used in the analysis due to the additional requirement of sequencing depth of the E24 sample (P value, exact binomial test).
Figure 3
Figure 3
Biological properties of activity-induced CpG methylation changes in the adult dentate gyrus. (a) Examples of bisulfite sequencing analysis of CpGs within five representative regions: Per2 (demethylated in TSS upstream region; chr1:93356934-93357200), Crebbp (demethylated in the exon; chr16:4085747-4086068), Grip1 (demethylated in the intron; chr10:119374673-119374888), Zfhx2 (de novo methylated in the exon; chr14:55691325-55691565), and Ccdc33 (de novo methylated in the intron; chr9:57897719-57898139). Shown are bisulfite sequencing results of these representative regions of interest at E0 (gray dots) and E4 (open circles) from multiple individual animals. Lines represent mean values. Arrowheads point to MSCC sites of interest. (b) Summaries of methylation changes at the MSCC sites upon different manipulations (with independent corresponding controls). CCP (10 mg/kg body weight) or saline was injected 1 hr before ECS. RG108 (1 mM), 5-azacytidine (5-AzaC; 1 mM), or saline was infused into lateral ventricles 2 days before ECS. Adult male Gadd45b knockout (G45b-KO) and wild-type (WT) littermates were used as indicated. Data represent a minimal of 20 bisulfite reads for each condition from at least two animals.
Figure 4
Figure 4
Voluntary exercise-induced CpG methylation changes in dentate granule cells of the adult mouse hippocampus. (a) Strip plot of methylation levels of CpGs from three control mice (filled circles) and three mice with running (open circles). Adult mice were housed in standard cages with or without free access to a running wheel for three days. Dentate gyrus tissues were microdissected for quantification of DNA methylation levels with HpaII-qPCR analysis for the same set of 48 CpGs as in Supplementary Fig 6a. (b) Heat maps for mean methylation changes of the set of 48 CpGs induced by a single ECS (at 4 hrs) or running (after three days). Values represent means from three sets of animals. About 67% of CpGs examined exhibit similar methylation changes 4 hrs after ECS and 3 days after running (indicated by arrowheads).
Figure 5
Figure 5
Genomic characteristics of activity-modified CpGs. (a) Enrichment of activity-induced methylation changes in regions with low CpG density. Top: distributions of CpG densities of 500 bp windows flanking activity-modified CpGs (green), all MSCC 30+ sites (blue), and all CpGs in the mouse genome (orange); Bottom: boxplots showing median and quartiles of the three distributions (P value, Student's t-test). (b) Distribution of modified CpGs in different genomic subregions. Shown are pie-charts of unchanged (top) and activity-modified CpGs (bottom) mapped to each genomic subregion. TSS upstream: within 5 kb upstream from the transcription start site (TSS); TES downstream: within 5 kb downstream from the transcription end site (TES); intergenic: over 5 kb away from any known genes.
Figure 6
Figure 6
Correlation between changes in CpG methylation and gene expression and enrichment of activity-modified CpGs in brain-specific genes and neuronal pathways. (a) Correlation between activity-induced methylation changes of CpGs within different genomic subregions and mRNA level changes of associated genes between E4 and E0 (P values, Pearson's correlation test). (b, c) Tissue-specific expression (b) and GO analysis (c) of genes associated with activity-modified CpGs. Only non-redundant GO terms are shown in (c). To control for the gene length effect, only GO terms that show statistic significance using each of the three independent random CpG sets generated from all MSCC30+ sites are shown.

References

    1. Reik W. Stability and flexibility of epigenetic gene regulation in mammalian development. Nature. 2007;447:425–32. - PubMed
    1. Suzuki MM, Bird A. DNA methylation landscapes: provocative insights from epigenomics. Nat Rev Genet. 2008;9:465–76. - PubMed
    1. Ma DK, et al. Epigenetic choreographers of neurogenesis in the adult mammalian brain. Nat Neurosci. 2010;13:1338–44. - PMC - PubMed
    1. Wu SC, Zhang Y. Active DNA demethylation: many roads lead to Rome. Nat Rev Mol Cell Biol. 2010;11:607–20. - PMC - PubMed
    1. Zemach A, McDaniel IE, Silva P, Zilberman D. Genome-wide evolutionary analysis of eukaryotic DNA methylation. Science. 2010;328:916–9. - PubMed

Publication types

Associated data