

Long Run Returns to Education: Does Schooling Lead to an Extended Old Age?
Affiliations
- PMID: 21874068
- PMCID: PMC3160637
Item in Clipboard
Long Run Returns to Education: Does Schooling Lead to an Extended Old Age?
J Hum Resour.
.
Abstract
While there is no doubt that health is strongly correlated with education, whether schooling exerts a causal impact on health is not firmly established. We exploit a Dutch compulsory schooling law to estimate the causal effect of education on mortality. The reform provides a powerful instrument, significantly raising years of schooling, which, in turn, has a significant and robust negative effect on mortality. For men surviving to age 81, an extra year of schooling is estimated to reduce the probability of dying before the age of 89 by almost 3 percentage points relative to a baseline of 50 percent.
Figures

(A) Years of education by cohort. 1912–1922 birth-year cohorts, males, (B) Years of education by cohort. 1912–1922 birth-year cohorts, females. Data are from the 1997–2005 POLS. Fitted line is from a quadratic in cohort with the trend allowed to differ on either side of the reform threshold (as in the right-hand column of Table 2 – lowest AIC value).

Years of education by month-of-birth. Last six months of 1916 and first six months of 1917, males.

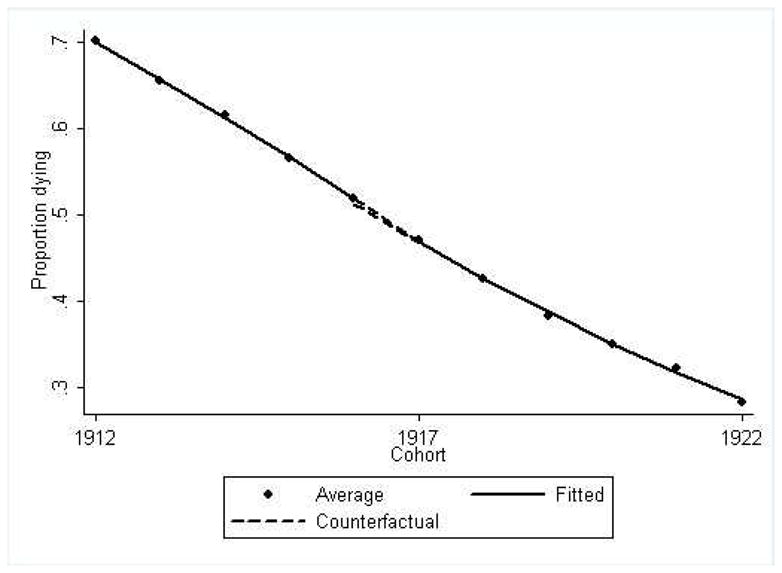
Proportion of the pooled 1997–2005 POLS sample that died before the end of 2005, by cohort. Fitted line is from a quadratic in cohort with the trend allowed to differ on either side of the reform threshold (as in the third column of Table 3 – lowest AIC value). Cohorts 1912–1922, males.

Eight-year mortality rate - proportion of the 1998 RIO sample that died before then end of 2005, by cohort. Fitted line is from a linear in cohort with the trend allowed to differ on either side of the reform threshold (as in the fourth column of Table 3 – lowest AIC value). Cohorts 1912–1922, males.

Proportion finishing high school by cohort. Data are from the 1997–2005 POLS. Fitted line is from a quadratic in cohort with the trend allowed to differ on either side of the reform threshold. Cohorts 1912–1922, males.
Eight-year mortality rate - proportion of the 1998 RIO sample that died in the period 1998–2005, by cohort. Fitted line is from a linear in cohort with the trend allowed to differ on either side of the reform threshold. Cohorts 1912–1922, females.
References
-
- Abbenhuis Maartje. The Art of Staying Neutral: The Netherlands in the First World War, 1914–1918. Amsterdam University Press; 2006. http://dare.uva.nl/aup/en/record/216555.
-
- Akaike Hirotugu. A New Look at the Statistical Model Identification. IEEE Transactions on Automatic Control. 1974;19(6):716–723.
-
- Albouy Valerie, Lequien Laurent. Does Compulsory Education Lower Mortality? Journal of Health Economics. 2009;28(1):155–168. - PubMed
-
- Almond Douglas. Is the 1918 Influenza Pandemic Over? Long-term Effects of In Utero Influenza Exposure in the Post-1940 U.S. Population. Journal of Political Economy. 2006;114(4):672–712.
-
- Angrist Joshua D, Krueger Alan B. The Effect of Age at School Entry on Educational Attainment: An Application of Instrumental Variables with Moments from Two Samples. Journal of the American Statistical Association. 1992;87(418):328–336.
Grants and funding
LinkOut - more resources
Full Text Sources