. 2012 Aug;14(4):431-42.
doi: 10.1007/s11307-011-0517-z.

A multimode optical imaging system for preclinical applications in vivo: technology development, multiscale imaging, and chemotherapy assessment

Affiliations

A multimode optical imaging system for preclinical applications in vivo: technology development, multiscale imaging, and chemotherapy assessment

Jae Youn Hwang et al. Mol Imaging Biol. 2012 Aug.

Abstract

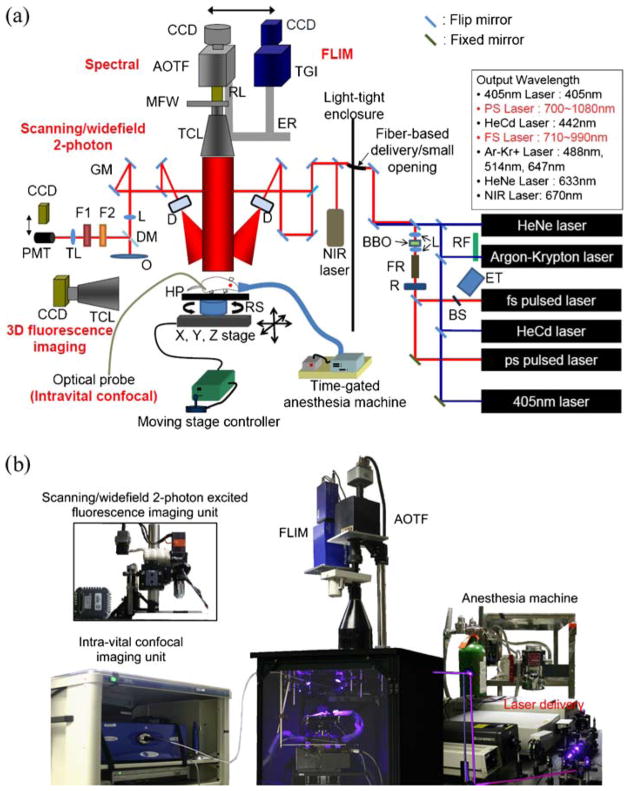
Purpose: Several established optical imaging approaches have been applied, usually in isolation, to preclinical studies; however, truly useful in vivo imaging may require a simultaneous combination of imaging modalities to examine dynamic characteristics of cells and tissues. We developed a new multimode optical imaging system designed to be application-versatile, yielding high sensitivity, and specificity molecular imaging.

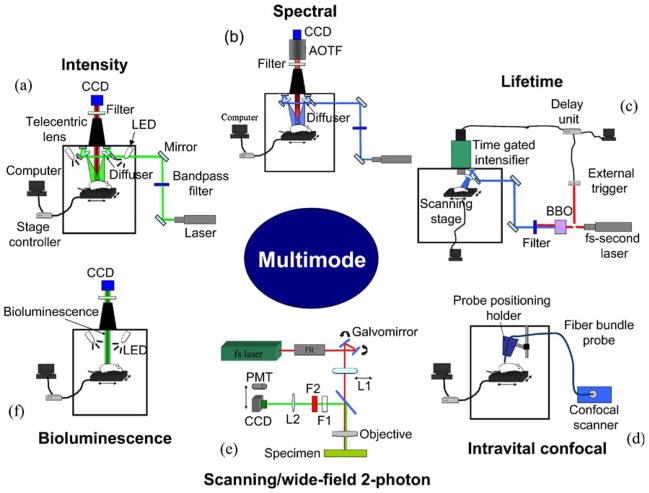
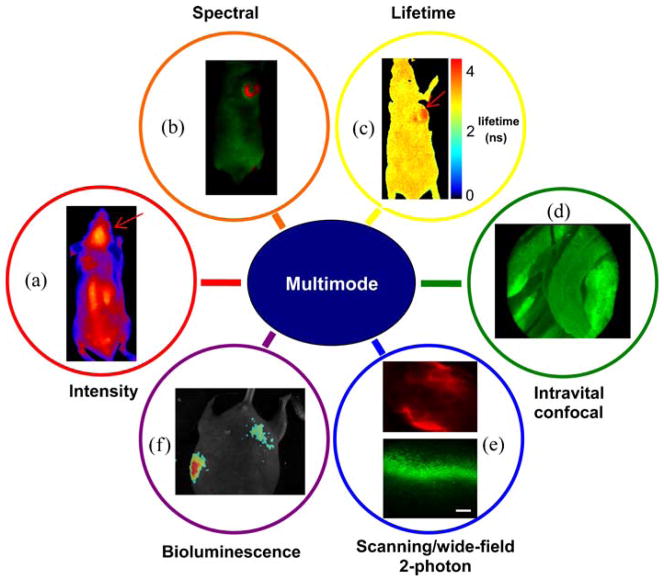
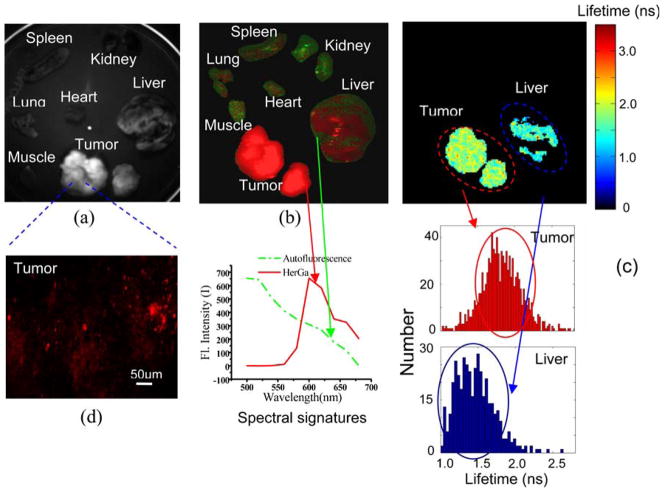
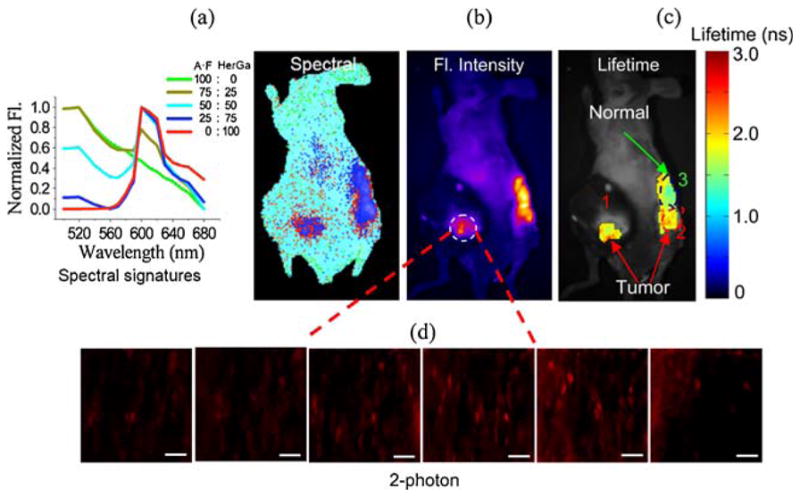
Procedures: We integrated several optical imaging technologies, including fluorescence intensity, spectral, lifetime, intravital confocal, two-photon excitation, and bioluminescence, into a single system that enables functional multiscale imaging in animal models.

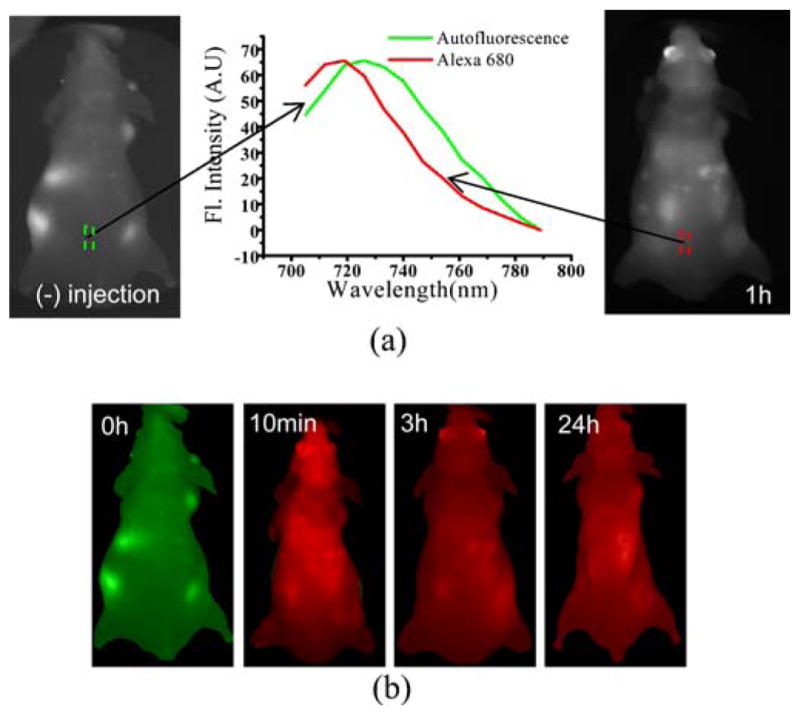
Results: The approach offers a comprehensive imaging platform for kinetic, quantitative, and environmental analysis of highly relevant information, with micro-to-macroscopic resolution. Applied to small animals in vivo, this provides superior monitoring of processes of interest, represented here by chemo-/nanoconstruct therapy assessment.

Conclusions: This new system is versatile and can be optimized for various applications, of which cancer detection and targeted treatment are emphasized here.


Conflict of interest statement

Conflict of Interest. The authors declare they have no conflicts of interest.

Figures

Fig. 1
Fig. 1
Multimode optical imaging system. a System schematic. This system is capable of several imaging modes, including fluorescence intensity, spectral, life time, intravital confocal, and bioluminescence imaging. Also, for 3D fluorescence imaging, optical components and a control program are installed. Furthermore, scanning/WTEF imaging mode will be incorporated with the system for deep tissue imaging at high resolution. b Photographic image of the multimode optical imaging system. MFW motorized filter wheel, RL relay lens, TCL telecentric lens, ER mode exchange rail, GM galvo mirror, TL tube lens, F1 band-pass filter, F2short-pass filter, DM dichroic mirror, L doublet lens, HP heating pad, D diffuser, RS rotational stage, FR faraday rotator, R retarder, RF rotational filters, BS beam sampler, ET external trigger for FLIM.
Fig. 2
Fig. 2
Experimental setup of each mode. a Fluorescence imaging mode. Selected light sources divided by a 50:50 dichroic mirror in a light-tight enclosure are delivered into a specimen through two diffusers. Then, fluorescence collected by a telecentric lens from a specimen is recorded in CCD through a selected filter. b Spectral imaging mode. An excitation method procedure is identical with the method in fluorescence intensity imaging. AOTF is employed between a filter and CCD for band-sequential spectral selection. c mosaic FLIM using fs pulsed laser light. fs pulsed laser light was used for the excitation of the molecules of interest. A specimen was scanned by xy translation motorized stage for LFOV controlled by the developed program, which is connected with the actuation motor control program through a TCP/IP internet connection. d Intravital confocal imaging mode. S-probe with a diameter, 0.65 mm is utilized for intravital confocal imaging. The probe has 0 μm working distance, 5 μm lateral resolution, and 15 μm axial resolution. The image obtained using the probe has 599×500 μm field of view and 450×384 pixels. e Scanning/WTEF imaging modes. L1 is a doublet lens that enables wider excitation and is removed in scanning two-photon imaging mode. F1 and F2 are shortpass filter (<700 nm) and interference filter, respectively. L2 is a tube lens. f Bioluminescence imaging modes. Bioluminescence signal is collected by a telecentric lens, and then recorded in the cooled CCD. After bioluminescence imaging is completed, a photographic image is acquired with LED illumination for overlaying with the bioluminescence image.
Fig. 3
Fig. 3
Images obtained by using each mode of multimode optical imaging system. a Fluorescence intensity image of the drug molecules preferentially accumulating into implanted brain tumors in the mouse. The arrow indicates a brain tumor. b Spectral classification image of a nude mouse with injection of fluorescein into implanted tumors and an engineered mouse pup with GFP expression. While red pseudocolor represents fluorescence of fluorescein (the left image) and GFP (the right image), green pseudocolor represents autofluorescence. c Fluorescence lifetime image obtained by mFLIM. The mouse was scanned by the system step-by-step for LFOV. Two sets of images were merged into a single image. For each fluorescence lifetime image, a total of 39 images have been acquired within 0 to 7,800 ps with a time step, 200 ps. d Intravital confocal image of a rat spine. The image (skeletal muscles) was extracted from the video file recorder for 8 min. e WTEF images (scale bar, 50 μm) of a mouse intestine and scanning two-photon excited fluorescence image (scale bar, 100 μm) of a mouse liver stained with fluorescein. A WTEF image (upper) is acquired with 795 nm excitation pulsed laser and an emission filter (620±60 nm), and then a flat-field corrected image was generated by a constructed Gaussian mask. For the scanning two-photon excitation of the liver, fs pulsed laser light at 780 nm was here used, and a shortpass filter (<700 nm) and a bandpass filter (540±40 nm) were utilized for the emission light selection. A Nikon 40× (NA: 0.75) and a Nikon 20× objective (NA: 0.50) were used for WTEF and scanning two-photon excited fluorescence imaging, respectively. f Bioluminescence image from engineered mice (normalized by highest value).
Fig. 4
Fig. 4
Clearance examination of the drug nanoconstruct using spectral imaging. a Spectral signatures of autofluorescence and fluorescence of Alexafluor 680. The spectral signature of autofluorescence and Alexafluor 680 fluorescence is obtained from a spectral image cube (700 to 790 nm) acquired before and after intravenous injection of the nanoconstruct respectively. b Spectral classification images at different time points. A total of 13 images were recorded within the spectral range of 705 to 789 nm with a step size 7 nm at different time points (0 h, 10 min, 3 h, and 24 h). Then, those images were analyzed with the previously acquired signatures using our developed program. Here, while green pseudocolor represents autofluorescence, red pseudocolor represents Alexafluor 680.
Fig. 5
Fig. 5
Specific organs and tumor images obtained using multi-mode optical imaging. a Fluorescence intensity image of organs and tumors at 620 nm. b Spectral classified image. A total of ten images were recorded within the spectral range of 500 to 680 nm with a step size of 20 nm. Then, the images were analyzed using software we developed. While the red color represents HerGa fluorescence, the green color represents autofluorescence. Spectral signatures of autofluorescence (green) and HerGa (red) were extracted from a pre-constructed signature library. c Fluorescence lifetime images of tumors and liver (the upper image) and the fluorescence lifetime histograms (the lower image). d Two-photon excited fluorescence image of tumors. The image of tumor was acquired using fs pulsed laser at 848 nm, an emission filter with 620±60 nm, Nikon 60× objective.
Fig. 6
Fig. 6
Multimodal optical imaging for cancer detection and delineation of HerGa. a Spectrally classified image. This spectral classified image was obtained through using the signatures (left side) constituted of various ratios of autofluorescence and HerGa fluorescence. b Fluorescence intensity image. c Fluorescence lifetime image. HerGa injection area: (1) tumor, (2) tumor, and (3) non-tumor. d Two-photon excited fluorescence images of tumor regions. These two-photon excited fluorescence images of tumor were acquired at the different focal planes (20, 40, 60, 80, 100, and 120 μm; ex, 848 nm; em, 620±60 nm, and Nikon 60× objective). The scale bar represents 50 μm.

References

    1. Weissleder R. Scaling down imaging: molecular mapping of cancer in mice. Nat Rev Cancer. 2002;2:11–18. - PubMed
    1. Contag CH. In vivo pathology: seeing with molecular specificity and cellular resolution in the living body. Annu Rev Pathol. 2007;2:277–305. - PubMed
    1. Rice BW, Cable MD, Nelson MB. In vivo imaging of light-emitting probes. J Biomed Opt. 2001;6:432–440. - PubMed
    1. Deniset-Besseau A, Leveque-Fort S, Fontaine-Aupart MP, et al. Three-dimensional time-resolved fluorescence imaging by multifocal multiphoton microscopy for a photosensitizer study in living cells. Appl Opt. 2007;46:8045–8051. - PubMed
    1. Zacharakis G, Ripoll J, Weissleder R, et al. Fluorescent protein tomography scanner for small animal imaging. IEEE Trans Med Imaging. 2005;24:878–885. - PubMed

Publication types

Substances

LinkOut - more resources