

Quantification of pH gradients and implications in insulator-based dielectrophoresis of biomolecules
- PMID: 21874654
- PMCID: PMC3226333
- DOI: 10.1002/elps.201100090
Quantification of pH gradients and implications in insulator-based dielectrophoresis of biomolecules
Abstract
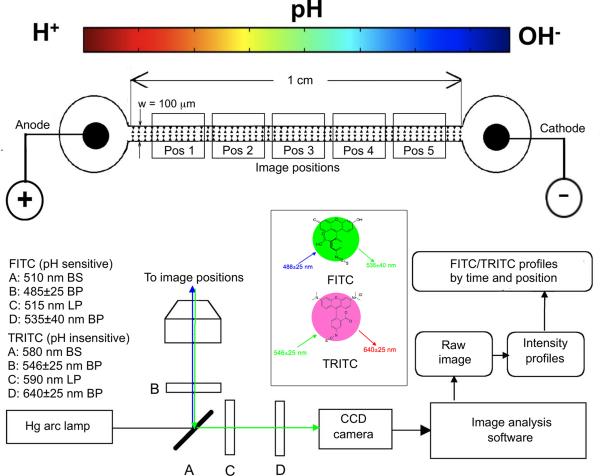
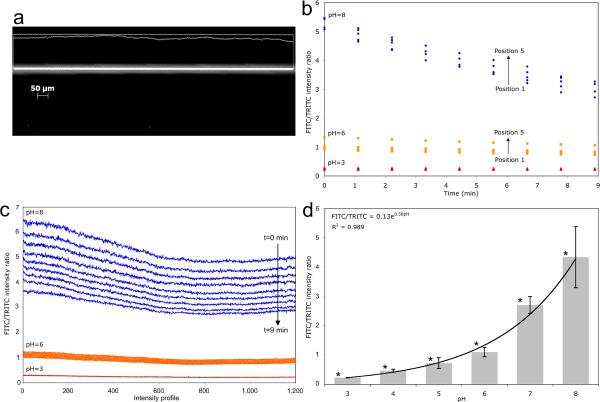
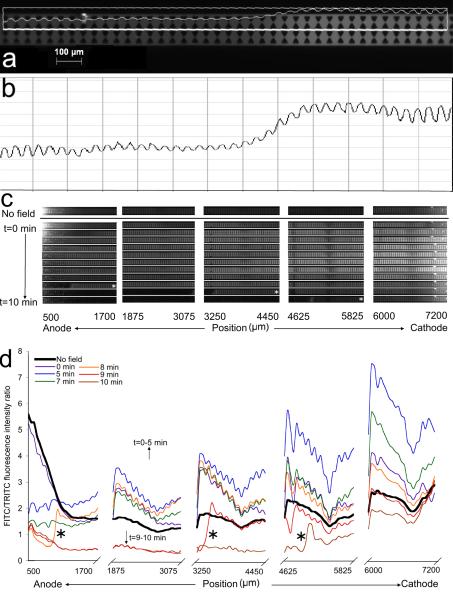
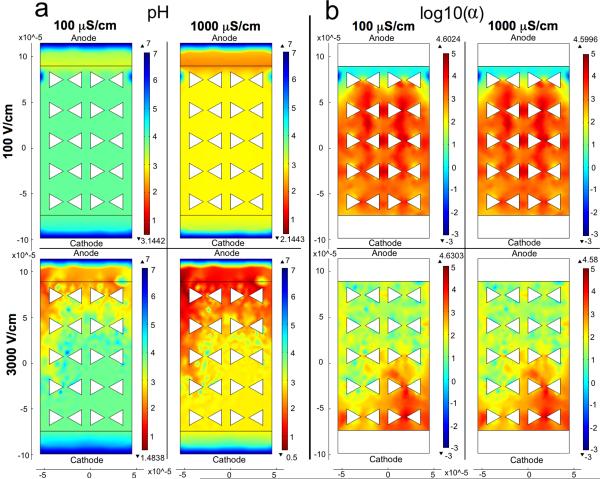
Direct current (DC) insulator-based dielectrophoretic (iDEP) microdevices have the potential to replace traditional alternating current dielectrophoretic devices for many cellular and biomolecular separation applications. The use of large DC fields suggest that electrode reactions and ion transport mechanisms can become important and impact ion distributions in the nanoliters of fluid in iDEP microchannels. This work tracked natural pH gradient formation in a 100 μm wide, 1 cm-long microchannel under applicable iDEP protein manipulation conditions. Using fluorescence microscopy with the pH-sensitive dye FITC Isomer I and the pH-insensitive dye TRITC as a reference, pH was observed to drop drastically in the microchannels within 1 min in a 3000 V/cm electric field; pH drops were observed in the range of 6-10 min within a 100 V/cm electric field and varied based on the buffer conductivity. To address concerns of dye transport impacting intensity data, electrokinetic mobilities of FITC were carefully examined and found to be (i) toward the anode and (ii) 1 to 2 orders of magnitude smaller than H⁺ transport which is responsible for pH drops from the anode toward the cathode. COMSOL simulations of ion transport showed qualitative agreement with experimental results. The results indicate that pH changes are severe enough and rapid enough to influence the net charge of a protein or cause aggregation during iDEP experiments. The results also elucidate reasonable time periods over which the phosphate buffering capacity can counter increases in H⁺ and OH⁻ for unperturbed iDEP manipulations.
Copyright © 2011 WILEY-VCH Verlag GmbH & Co. KGaA, Weinheim.
Figures
Similar articles
-
A continuous DC-insulator dielectrophoretic sorter of microparticles.J Chromatogr A. 2011 Apr 1;1218(13):1780-9. doi: 10.1016/j.chroma.2011.01.082. Epub 2011 Feb 4. J Chromatogr A. 2011. PMID: 21338990
-
Characterization of electrokinetic mobility of microparticles in order to improve dielectrophoretic concentration.Anal Bioanal Chem. 2009 May;394(1):293-302. doi: 10.1007/s00216-009-2626-y. Epub 2009 Feb 4. Anal Bioanal Chem. 2009. PMID: 19190896
-
Protein manipulation with insulator-based dielectrophoresis and direct current electric fields.J Chromatogr A. 2008 Oct 3;1206(1):45-51. doi: 10.1016/j.chroma.2008.05.077. Epub 2008 Jun 18. J Chromatogr A. 2008. PMID: 18571183
-
Review of nonlinear electrokinetic flows in insulator-based dielectrophoresis: From induced charge to Joule heating effects.Electrophoresis. 2022 Jan;43(1-2):167-189. doi: 10.1002/elps.202100090. Epub 2021 May 24. Electrophoresis. 2022. PMID: 33991344 Review.
-
Insulator Based Dielectrophoresis: Micro, Nano, and Molecular Scale Biological Applications.Sensors (Basel). 2020 Sep 7;20(18):5095. doi: 10.3390/s20185095. Sensors (Basel). 2020. PMID: 32906803 Free PMC article. Review.
Cited by
-
Refinement of insulator-based dielectrophoresis.Analyst. 2017 May 2;142(9):1608-1618. doi: 10.1039/c6an02509a. Analyst. 2017. PMID: 28394391 Free PMC article.
-
Protein dielectrophoresis and the link to dielectric properties.Bioanalysis. 2015;7(3):353-71. doi: 10.4155/bio.14.306. Bioanalysis. 2015. PMID: 25697193 Free PMC article. Review.
-
Material-selective separation of mixed microparticles via insulator-based dielectrophoresis.Biomicrofluidics. 2019 Nov 15;13(6):064112. doi: 10.1063/1.5124110. eCollection 2019 Nov. Biomicrofluidics. 2019. PMID: 31768198 Free PMC article.
-
Refinement of current monitoring methodology for electroosmotic flow assessment under low ionic strength conditions.Biomicrofluidics. 2016 Jun 3;10(3):033104. doi: 10.1063/1.4953183. eCollection 2016 May. Biomicrofluidics. 2016. PMID: 27375813 Free PMC article.
-
Dielectrophoresis of proteins: experimental data and evolving theory.Anal Bioanal Chem. 2020 Jun;412(16):3801-3811. doi: 10.1007/s00216-020-02623-7. Epub 2020 Apr 21. Anal Bioanal Chem. 2020. PMID: 32314000 Free PMC article.
References
-
- Pohl HA. Dielectrophoresis. Cambridge University Press; Cambridge, UK: 1978.
-
- Cummings EB, Singh AK. Anal. Chem. 2003;75:4724–4731. - PubMed
-
- Regtmeier J, Duong TT, Eichhorn R, Anselmetti D, Ros A. Anal. Chem. 2007;79:3925–3932. - PubMed
-
- Regtmeier J, Eichhorn R, Bogunovic L, Ros A, Anselmetti D. Anal. Chem. 2010;82:7141–7149. - PubMed
-
- Gallo-Villanueva RC, Rodriguez,-Lopez RC, Diaz-De-La-Garza RI. Electrophoresis. 2000;30:4195–4205. - PubMed
Publication types
MeSH terms
Substances
Grants and funding
LinkOut - more resources
Full Text Sources
Other Literature Sources
