. 2011 Dec;141(6):2210-2217.e2.
doi: 10.1053/j.gastro.2011.08.033. Epub 2011 Aug 27.

Intra-acinar trypsinogen activation mediates early stages of pancreatic injury but not inflammation in mice with acute pancreatitis

Affiliations

Intra-acinar trypsinogen activation mediates early stages of pancreatic injury but not inflammation in mice with acute pancreatitis

Rajinder Dawra et al. Gastroenterology. 2011 Dec.

Abstract

Background & aims: The role of trypsinogen activation in the pathogenesis of acute pancreatitis (AP) has not been clearly established.

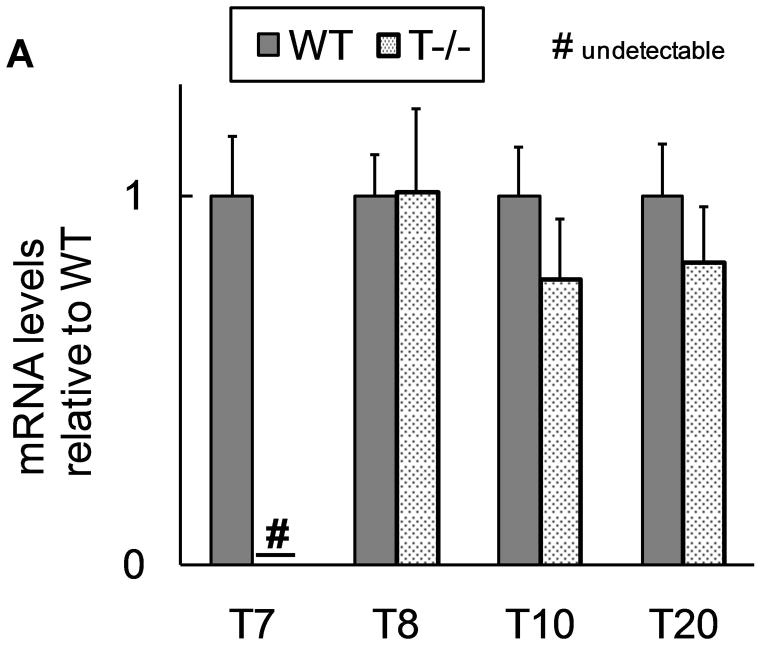
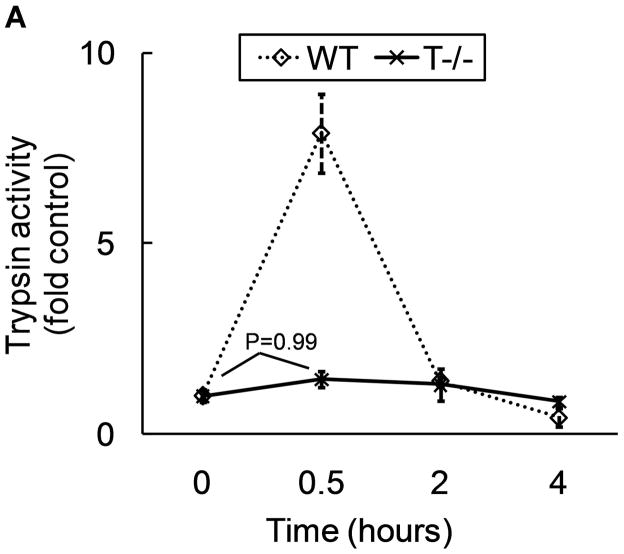
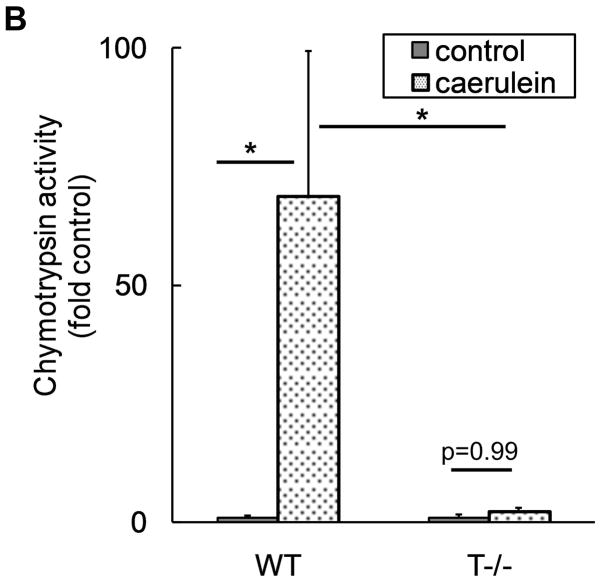
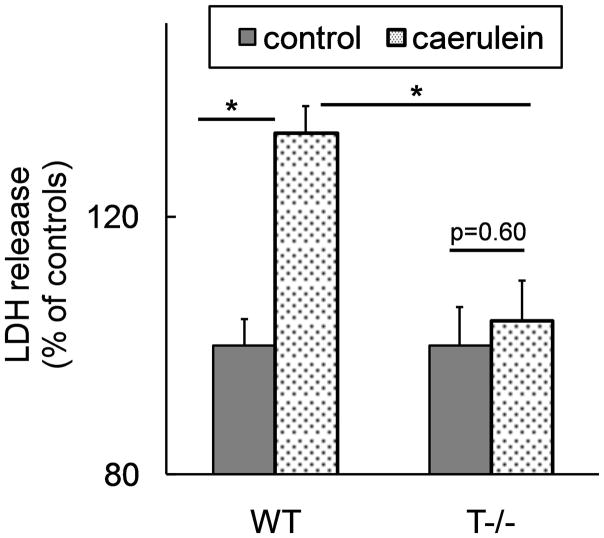
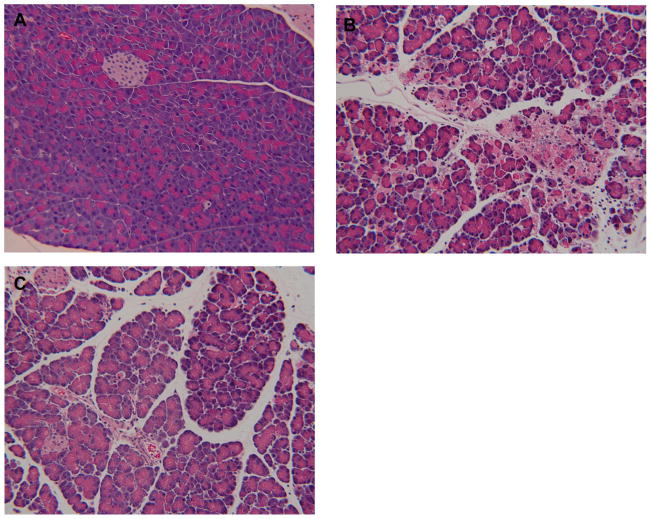
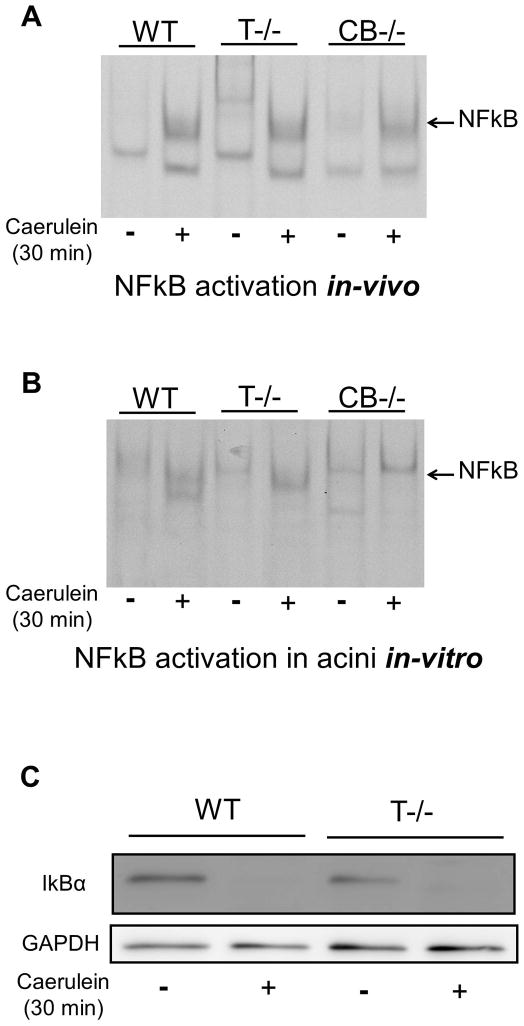
Methods: We generated and characterized mice lacking trypsinogen isoform 7 (T7) gene (T(-/-)). The effects of pathologic activation of trypsinogen were studied in these mice during induction of AP with cerulein. Acinar cell death, tissue damage, early intra-acinar activation of the transcription factor nuclear factor κB (NF-κB), and local and systemic inflammation were compared between T(-/-) and wild-type mice with AP.

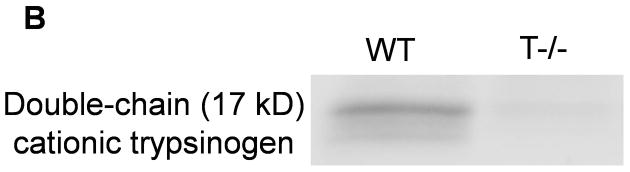
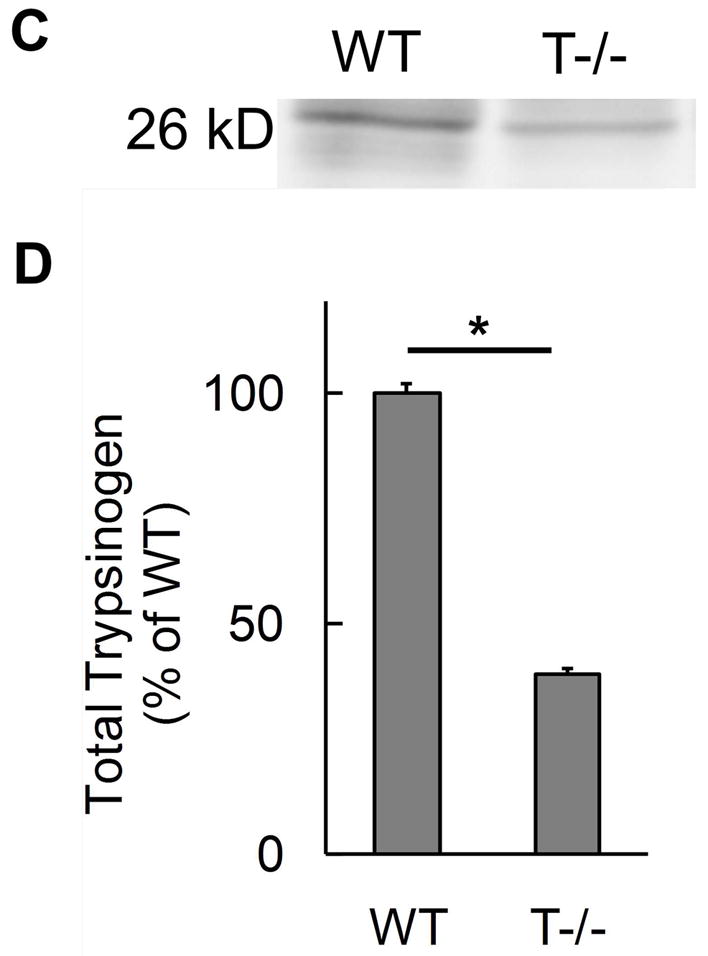
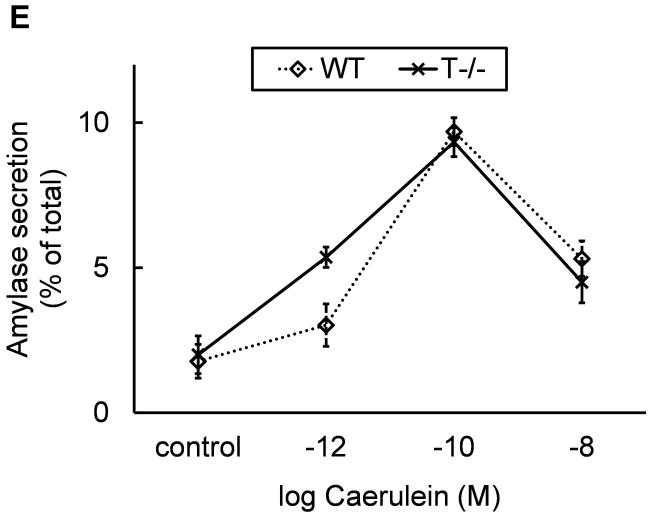
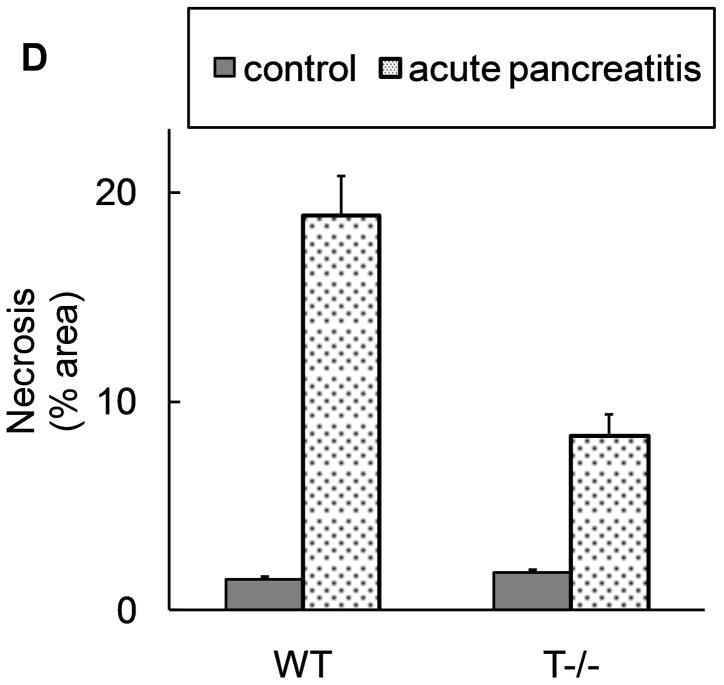
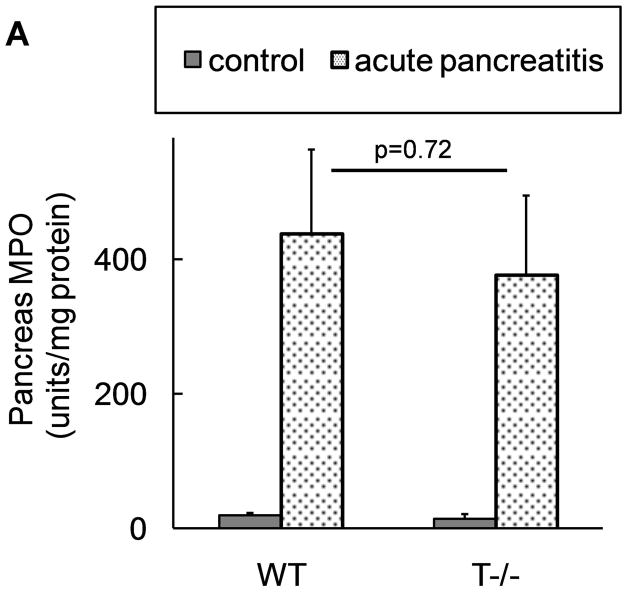
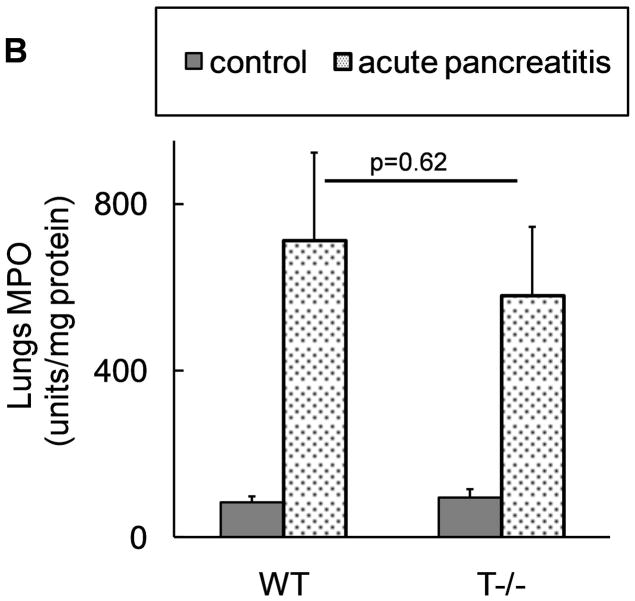
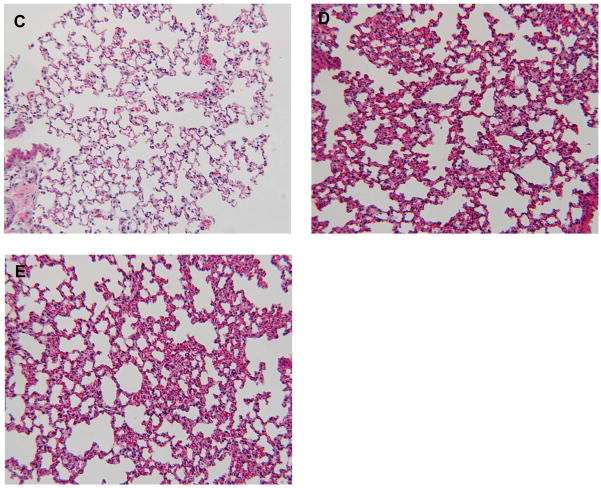
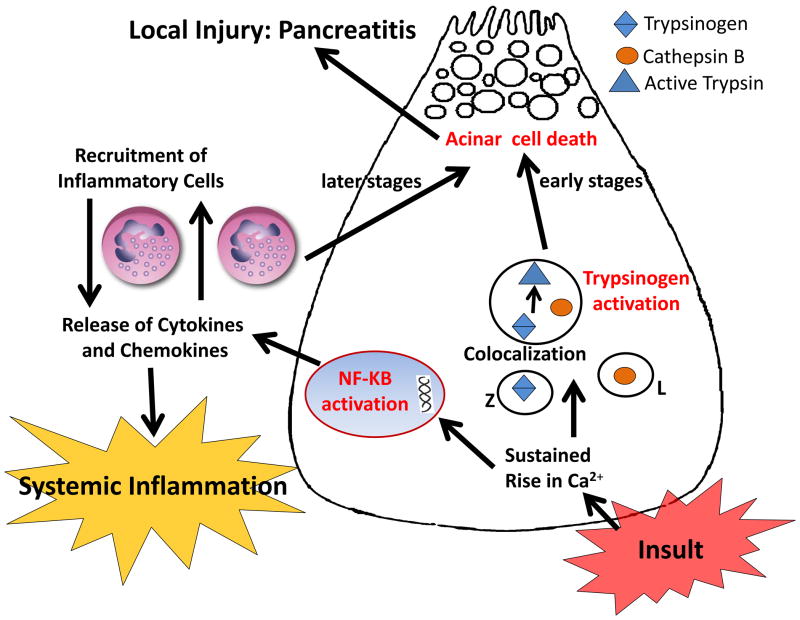
Results: Deletion of T7 reduced the total trypsinogen content by 60% but did not affect physiologic function. T(-/-) mice lacked pathologic activation of trypsinogen, which occurs within acinar cells during early stages of AP progression. Absence of trypsinogen activation in T(-/-) mice led to near complete inhibition of acinar cell death in vitro and a 50% reduction in acinar necrosis during AP progression. However, T(-/-) mice had similar degrees of local and systemic inflammation during AP progression and comparable levels of intra-acinar NF-κB activation, which was previously shown to occur concurrently with trypsinogen activation during early stages of pancreatitis.

Conclusions: T7 is activated during pathogenesis of AP in mice. Intra-acinar trypsinogen activation leads to acinar death during early stages of pancreatitis, which accounts for 50% of the pancreatic damage in AP. However, progression of local and systemic inflammation in AP does not require trypsinogen activation. NF-κB is activated early in acinar cells, independently of trypsinogen activation, and might be responsible for progression of AP.


Conflict of interest statement

Conflict of interest: None to disclose.

Figures

Figure 1
Figure 1. Characterization of T−/− mice
A) Absence of trypsinogen isoform-7 gene in T−/−mice: The mRNA transcript of trypsinogen isoform-7 gene is absent in T−/− mice while the expression of other isoforms of trypsinogen is not affected (n=8 each group). B and C) Reduction of total trypsinogen in T−/− mice: The 26kD band in T−/− lane is significantly reduced in intensity signifying reduction in total trypsinogen (B). On quantification (C), there was 60% reduction of total trypsingoen in T−/− mice as compared to WT (n≥3 for each group). The 17kD band (B) is suspected to be cationic trypsinogen/T7 specific peptide (from its double-chain form) based on studies on human cationic trypsinogen (40, 41), and its absence in T−/−mice strongly suggests the absence of cationic trypsinogen in T−/− mice. See text for further details. D) Dose response curve for amylase secretion in response to caerulein in-vitro. WT and T−/− acini demonstrate similar secretory response on stimulation with indicated concentrations of caerulein for 30 minutes. Data pooled from three experiments.
Figure 2
Figure 2. T−/− mice lack pathologic trypsinogen activation
A) Trypsinogen activation was measured at indicated time points after caerulein (50μg/kg i.p. every hour). For controls and 30 minutes, n=12–15 per group, pooled from 3 independent experiments. N=6 per group for 2 hour and 4 hour points. p<0.0001 for WT controls Vs WT 30 minutes and for WT 30 minutes Vs T−/−30 minutes. p>0.90 for all other pair-wise comparisons. B) Chymotrypsinogen activation is dependent on trypsinogen activation and is absent in T−/− mice. Chymotrypsin activity was measured 30 minutes after caerulein (50μg/kg i.p.). N=10–13 per group, pooled from 2 independent experiments. p=0.007 for WT control Vs WT caerulein; p=0.02 for WT caerulein Vs T−/− caerulein.
Figure 3
Figure 3. Cell death in response to caerulein supramaximal stimulation is abrogated in acini from T−/− mice
LDH activity was measured in the supernatant after 3 hours of incubation with or without 100nM caerulein and data were normalized to protein content in each well. The data are expressed as percentage of LDH release in the absence of caerulein. N=6 per group, each well in triplicate. p=0.003 WT caerulein Vs T−/− caerulein group.
Figure 4
Figure 4. T−/− mice demonstrate about half of acinar necrosis Vs WT mice during acute pancreatitis
Acute pancreatitis was induced by caerulein (50μg/kg i.p. every hour for 10 hours). A–C: representative pictures at 10x field (H and E stain). A) normal pancreas from saline injected mice. B) Presence of significant degree of acinar injury, edema and neutrophil infiltration in wild type mice. C) Less acinar injury in T−/− mice. D) Quantification of necrosis by morphometry. N=18 per group from 3 independent experiments. p<0.00001 for WT AP Vs T−/−AP.
Figure 5
Figure 5. Comparable local and systemic inflammation during acute pancreatitis in WT and T−/− mice
Neutrophil infiltration in (A) pancreas (n=18 per group from 3 independent experiments) and (B) lungs (n=12 per group from 3 independent experiments). C–E: Representative pictures of lungs at 10x field (H and E stain). C) control, D) WT and E) T−/− mice with pancreatitis, demonstrating similar parenchymal damage, edema and inflammatory infiltrate in the lungs.
Figure 6
Figure 6. NFkB is activated early in parallel but independent of trypsinogen activation during acute pancreatits
A and B: NFkB activation was assessed by EMSA. A) NFkB is activated in the pancreas of mice receiving caerulein (50μg/kg i.p.) as assessed after 30 minutes. Pictures are representative of results from 3 independent experiments. B) NFkB activation in acinar cells in-vitro. Acini from WT, T−/− and CB−/− mice were incubated with or without 100nM caerulein for 30 minutes. Pictures are representative of results from 3 independent experiments. C) IkBα degradation demonstrated in the cytosolic fraction of pancreas from mice (WT and T−/−) after 30 minutes of caerulein injection (50μg/kg i.p).
Figure 7
Figure 7. A simplified schematic describing the pathogenesis of acute pancreatitis
Intra-acinar trypsinogen activation and NFkB activation are activated independently and in parallel early during pancreatitis. Trypsinogen activation contributes to acinar injury during early pancreatitis, which accounts for about half of total pancreatic damage. NFkB activation, known to be associated with several inflammatory diseases, leads to production of inflammatory mediators which elicits severe local inflammation causing further pancreatic damage (the other half of the pancreatic damage). The production of inflammatory mediators from acini as well as from incumbent inflammatory infiltrate leads to the widespread systemic inflammation during acute pancreatitis.

Comment in

References

    1. Banks PA, Freeman ML. Practice guidelines in acute pancreatitis. Am J Gastroenterol. 2006;101(10):2379–400. - PubMed
    1. Fagenholz PJ, Fernandez-del Castillo C, Harris NS, et al. Direct medical costs of acute pancreatitis hospitalizations in the United States. Pancreas. 2007;35(4):302–7. - PubMed
    1. Chiari H. ÜberdieSelbstverdauung des menschlichenPankreas. ZeitschriftfürHeilkunde. 1896;17:69–96.
    1. Hofbauer B, Saluja AK, Lerch MM, et al. Intra-acinar cell activation of trypsinogen during caerulein-induced pancreatitis in rats. Am J Physiol. 1998;275(2 Pt 1):G352–62. - PubMed
    1. Saluja AK, Bhagat L, Lee HS, et al. Secretagogue-induced digestive enzyme activation and cell injury in rat pancreatic acini. Am J Physiol. 1999;276(4 Pt 1):G835–42. - PubMed

Publication types