. 2011 Sep 26;208(10):2033-42.
doi: 10.1084/jem.20110200. Epub 2011 Aug 29.

WASp-deficient B cells play a critical, cell-intrinsic role in triggering autoimmunity

Affiliations

WASp-deficient B cells play a critical, cell-intrinsic role in triggering autoimmunity

Shirly Becker-Herman et al. J Exp Med. .

Abstract

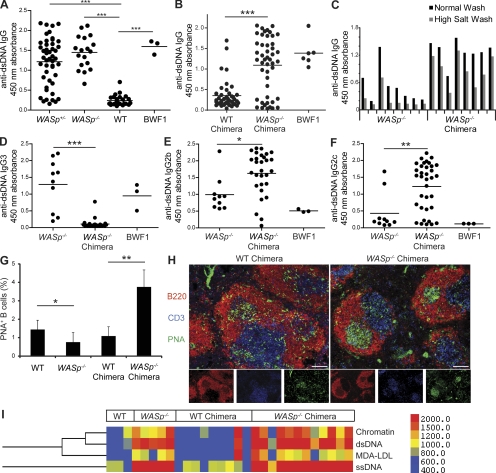
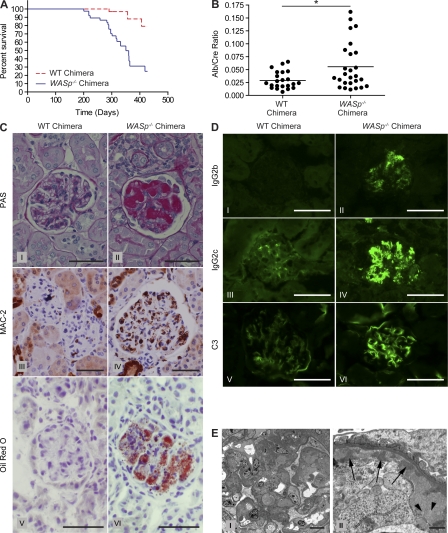
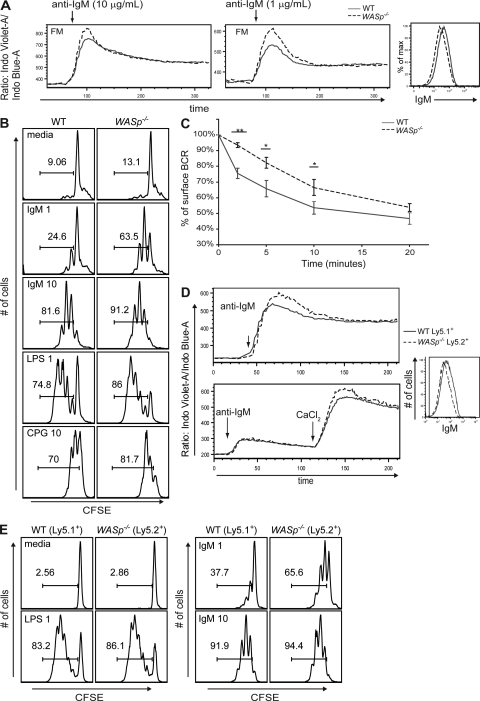
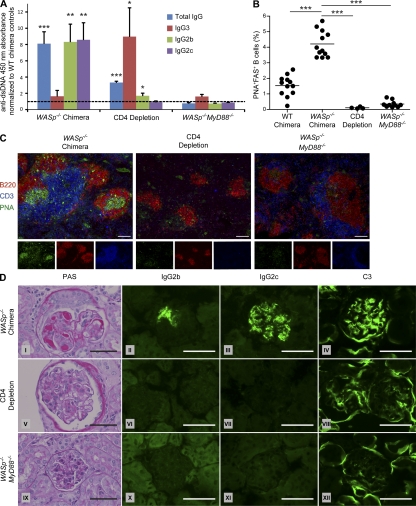
Patients with the immunodeficiency Wiskott-Aldrich syndrome (WAS) frequently develop systemic autoimmunity. Here, we demonstrate that mutation of the WAS gene results in B cells that are hyperresponsive to B cell receptor and Toll-like receptor (TLR) signals in vitro, thereby promoting a B cell-intrinsic break in tolerance. Whereas this defect leads to autoantibody production in WAS protein-deficient (WASp(-/-)) mice without overt disease, chimeric mice in which only the B cell lineage lacks WASp exhibit severe autoimmunity characterized by spontaneous germinal center formation, class-switched autoantibodies, renal histopathology, and early mortality. Both T cell help and B cell-intrinsic TLR engagement play important roles in promoting disease in this model, as depletion with anti-CD4 antibodies or generation of chimeric mice with B cells deficient in both WASp and MyD88 prevented development of autoimmune disease. These data highlight the potentially harmful role for cell-intrinsic loss of B cell tolerance in the setting of normal T cell function, and may explain why WAS patients with mixed chimerism after stem cell transplantation often develop severe humoral autoimmunity.


Figures

Figure 1.
Figure 1.
WASp−/− B cells are sufficient for high-affinity, class-switched autoantibody production and spontaneous GC formation. IgG anti-dsDNA autoantibody ELISAs in 6.5–12-mo-old female WASp+/−, WASp−/−, and WT mice (A) and WT and WASp−/− chimeras at 16 wk after transplant (B). BWF1: lupus-prone positive control, NZB/NZW-F1, 8 mo old. Sera diluted 1:200; each dot represents an individual animal. (C) ELISAs with low versus high stringency washing conditions used to detect high-affinity IgG anti-dsDNA antibodies in WASp−/− and WASp−/− chimeric mice (12 wk old or 12 wk after transplant). Each pair of bars represents an individual animal. (D–F) ELISAs to detect IgG subclass-specific anti-dsDNA antibodies. (WASp−/− chimeras, n = 29; WASp−/− mice, n = 10; 4 mo after transplant or 4 mo old, respectively). (G) Percentage of splenic B cells staining positive for PNA by flow cytometry in 6–8-mo-old WT (n = 7) and WASp−/− (n = 7) mice, as well as WT (n = 5) and WASp−/− (n = 4) BM chimeras 6–8 mo after transplant. (H) Immunofluorescent staining of splenic sections from BM chimeras showing representative follicles using B220 (red) CD3 (blue) and PNA (green); 10× objective was used for image capture; bars, 100 µm. (I) Antigen microarray showing IgG reactivity of WT, WASp−/−, WT chimera, and WASp−/− chimera sera with ssDNA, dsDNA, chromatin, and MDA-LDL. Sera from WT and WASp−/− mice (1 yr) and chimeric mice (6 mo after transplant). Scale shows digital fluorescence intensity units; 600 represents threshold for reactivity as described in Materials and methods. These data are representative of 4 independent experiments with 20–30 mice per experiment. *, P < 0.05; **, P < 0.005; ***, P < 0.0005.
Figure 2.
Figure 2.
WASp−/− chimeras develop systemic autoimmunity and exhibit early mortality. (A) Kaplan-Meier survival curve of WT chimeras (n = 37) and WASp−/− chimeras (n = 31). P < 0.0005. (B) Urine albumin/creatinine ratio in BM chimeras at 7–12 mo after transplant, WT chimeras (n = 22), and WASp−/− chimeras (n = 26). *, P < 0.05. (C) Representative glomeruli from WT and WASp−/− BM chimeras. PAS, Periodic acid-Schiff stain. Bars, 50 µm. (D) Immunofluorescence showing IgG2b and IgG2c subclass antibodies and complement C3 deposited in WASp−/− chimera glomeruli. Data in C and D are representative of mice 7 mo after transplant. Bars, 50 µm. (E) Electron micrographs of glomeruli of WASp−/− chimeras. Left: low power; 1600×; bar, 10 µm. Right: high power; 16,900×; bar, 1 µm. The images show confluent deposition of large amounts of electron-dense material (arrows) characteristic of immune complexes in subendothelial portions of glomerular capillary walls, admixed with aggregates of vesiculated material characteristic of lipoproteins, corresponding to the lipid deposits confirmed by oil red O staining (arrowheads; representative of four WASp−/− chimeras). Data are representative of four independent experiments; electron micrographs taken from only one experiment.
Figure 3.
Figure 3.
WASp−/− B cells are mildly hyper-responsive and display reduced BCR internalization. (A) Left and middle panel, Ca2+ flux in FM B cells stimulated with 10 or 1 µg/ml anti-IgM. (right) sIgM expression in WT versus WASp−/− FM B cells. Data are representative of 4 independent experiments (n = 8). (B) CFSE proliferation assay of sorted WT versus WASp−/− FM B cells on day 3 after stimulation (1 = 1 µg/ml; 10 = 10 µg/ml). Data are representative of 3 experiments (n = 10). (C) BCR internalization assay. WT and WASp−/− splenic B cells were incubated with biotinylated F(ab’)2 fragments to bind the BCR and chased for the indicated time points. Data are displayed as percentage of surface BCR relative to 0 time point. Data are representative of two independent experiments (n = 6 per experiment). (D and E) To assess the BCR signaling response in WT and WASp−/− B cells derived from the same environment, BM from WT (Ly5.1+) and WASp−/− (Ly5.2+) mice was mixed at a 50:50 ratio and transplanted into lethally irradiated μMT recipient mice; recipients were sacrificed at 6–8 wk after transplant. (D) Ca2+ flux in stimulated FM B cells in the presence (top) or absence (bottom) of extracellular Ca2+ showing response in WT (Ly5.1+) versus WASp−/− (Ly5.2+) gated FM populations stimulated with 10 µg/ml anti-IgM. (right) Relative sIgM expression in WT versus WASp−/− FM B cells. (E) Proliferation of sort-purified, WT (Ly5.1+) versus WASp−/− (Ly5.2+) FM B cells isolated from BM chimeras at day 3 after stimulation with the indicated mitogens. Data are representative of 2 independent experiments (n = 4 per experiment). FM B cells were sorted as CD19+CD24intCD21int cells, as previously described (Meyer-Bahlburg et al., 2008).
Figure 4.
Figure 4.
CD4 T cell depletion or B cell–intrinsic MyD88-deficiency prevents disease development in WASp−/− chimeras. (A) ELISAs were used to measure dsDNA-specific total IgG, IgG3, IgG2b, and IgG2c serum antibodies (18 wk after transplant) in WASp−/− chimeras, WASp−/− chimeras treated weekly with CD4-depleting antibody (CD4 Depletion), and WASp−/−MyD88−/− chimeras (WASp−/−MyD88−/−). Data are normalized to values obtained from WT chimera controls run alongside each experimental group, and significance tests demonstrate whether experimental values are statistically greater than control values for each ELISA. Dotted line is at normalized value 1, representing autoantibody levels in WT chimeras. (B) Percentage of splenic PNA+ FAS+ B cells in WT chimeras, WASp−/− chimeras, CD4-depleted WASp−/− chimeras and WASp−/−MyD88−/− chimeras (6 mo after transplant). (C) Immunofluorescent staining of splenic sections from WASp−/− chimeras (6 mo after transplant) to measure GC formation in WASp−/− chimeras, CD4-depleted WASp−/− chimeras, and WASp−/−MyD88−/− chimeras. Representative follicles (10× objective) are shown using B220 (red), CD3 (blue), and PNA (green). Bars, 100 µm. (D) Glomeruli of indicated chimeras were stained with the indicated reagents. PAS, Periodic acid-Schiff. Bars, 50 µm. *, P < 0.05; **P < 0.005; ***, P < 0.0005. Isotype-treated WT and WASp−/− chimeras showed no differences from untreated animals, respectively, and therefore data from isotype-treated mice are not shown as a separate group. Data are representative of two independent experiments with WASp−/−MyD88−/− chimeras (n = 30 and n = 15), and one independent CD4-depletion experiment (n = 24).

Comment in

References

    1. Andrews S.F., Rawlings D.J. 2009. Transitional B cells exhibit a B cell receptor-specific nuclear defect in gene transcription. J. Immunol. 182:2868–2878 - PMC - PubMed
    1. Antón I.M., de la Fuente M.A., Sims T.N., Freeman S., Ramesh N., Hartwig J.H., Dustin M.L., Geha R.S. 2002. WIP deficiency reveals a differential role for WIP and the actin cytoskeleton in T and B cell activation. Immunity. 16:193–204 10.1016/S1074-7613(02)00268-6 - DOI - PubMed
    1. Barr T.A., Brown S., Mastroeni P., Gray D. 2009. B cell intrinsic MyD88 signals drive IFN-gamma production from T cells and control switching to IgG2c. J. Immunol. 183:1005–1012 - PMC - PubMed
    1. Bolland S., Ravetch J.V. 2000. Spontaneous autoimmune disease in Fc(gamma)RIIB-deficient mice results from strain-specific epistasis. Immunity. 13:277–285 10.1016/S1074-7613(00)00027-3 - DOI - PubMed
    1. Bouma G., Burns S., Thrasher A.J. 2007. Impaired T-cell priming in vivo resulting from dysfunction of WASp-deficient dendritic cells. Blood. 110:4278–4284 10.1182/blood-2007-06-096875 - DOI - PubMed

Publication types