. 2011 Sep 26;208(10):1963-76.
doi: 10.1084/jem.20110198. Epub 2011 Aug 29.

Notch signaling inhibits hepatocellular carcinoma following inactivation of the RB pathway

Affiliations

Notch signaling inhibits hepatocellular carcinoma following inactivation of the RB pathway

Patrick Viatour et al. J Exp Med. .

Abstract

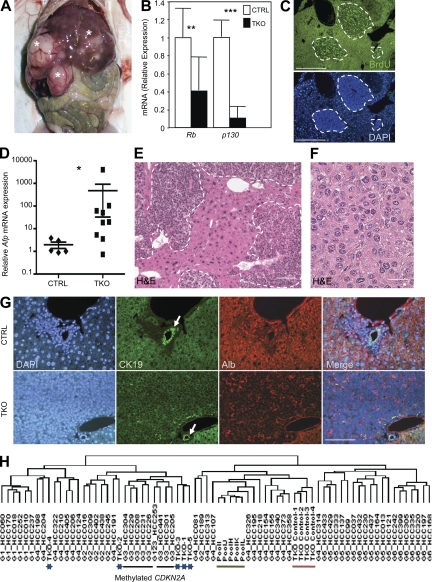
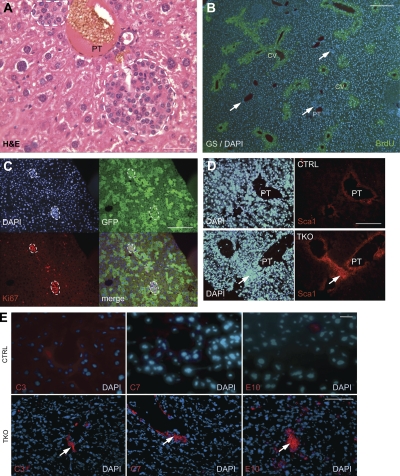
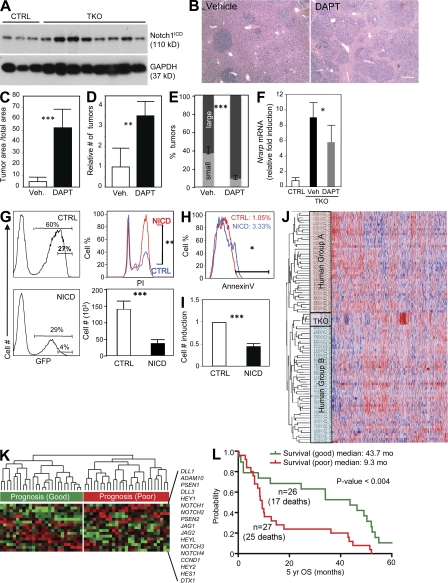
Hepatocellular carcinoma (HCC) is the third cancer killer worldwide with >600,000 deaths every year. Although the major risk factors are known, therapeutic options in patients remain limited in part because of our incomplete understanding of the cellular and molecular mechanisms influencing HCC development. Evidence indicates that the retinoblastoma (RB) pathway is functionally inactivated in most cases of HCC by genetic, epigenetic, and/or viral mechanisms. To investigate the functional relevance of this observation, we inactivated the RB pathway in the liver of adult mice by deleting the three members of the Rb (Rb1) gene family: Rb, p107, and p130. Rb family triple knockout mice develop liver tumors with histopathological features and gene expression profiles similar to human HCC. In this mouse model, cancer initiation is associated with the specific expansion of populations of liver stem/progenitor cells, indicating that the RB pathway may prevent HCC development by maintaining the quiescence of adult liver progenitor cells. In addition, we show that during tumor progression, activation of the Notch pathway via E2F transcription factors serves as a negative feedback mechanism to slow HCC growth. The level of Notch activity is also able to predict survival of HCC patients, suggesting novel means to diagnose and treat HCC.


Figures

Figure 1.
Figure 1.
Genetic inactivation of the Rb gene family in the mouse liver results in HCC development. (A) One representative (n > 20) TKO mouse with tumors (asterisks) in the liver is shown 4 mo after intrasplenic Ad-Cre injection. All experiments were performed on TKO mice 3–4 mo after Ad-Cre injection. (B) RT-qPCR analysis of Rb and p130 messenger RNA (mRNA) expression in TKO tumors (n = 9) and control livers (n = 5; CTRL, Rblox/lox;p130lox/lox;p107−/−). (C) Immunostaining on TKO liver sections for the DNA replication marker BrdU. Areas of proliferation are circled with dashed lines. (D) RT-qPCR analysis of Afp mRNA levels in TKO tumors (n = 9) and CTRL livers (n = 5). (E) H&E staining of TKO liver sections with multiple independent tumors (delineated by dashed lines). (F) At higher magnification, tumor cells resemble small hepatocytes. (G) Representative sections (n > 20) from CTRL and TKO livers were stained with DAPI, CK19, and Albumin (Alb). The white arrows point to a bile duct. Merged pictures are shown on the right. (H) Nonsupervised hierarchical clustering of gene expression profiles from human HCCs and mouse TKO tumors (blue asterisks). The black bar marks human tumors in the group G3, which are characterized in part by methylation of the CDKN2A locus. The green bar marks normal human liver samples, and the red bar marks CTRL mouse livers. Error bars indicate SEM. *, P < 0.05; **, P < 0.01; ***, P < 0.001. Bars: (C, E, and G) 50 µm; (F) 5 µm.
Figure 2.
Figure 2.
Inactivation of the Rb gene family in the adult liver results in the expansion of cells with features of stem/progenitor cells. (A) Representative H&E staining (n > 20) of the liver of a cTKO mouse infected with Ad-Cre (4 wk after the injection) shows that TKO early liver lesions are composed of small cells. White dashed lines indicate lesions. All mice used were between 2 and 4 mo of age at the time of injection. PT, portal triad. (B) Sections from TKO liver were stained antibodies against GS (green), a marker of hepatocytes around the central vein (CV). Immunofluorescence images were merged with DAPI (blue) images. The white arrows indicate early TKO lesions. (C) Early lesions in cTKO;Rosa26LSL-YFP mice infected with Ad-Cre were immunostained for Ki67 and GFP. White dashed lines indicate lesions. (D) Control (CTRL) and TKO liver sections were stained with Sca1 antibodies. The white arrows point to Sca1-positive cells. (E) CTRL and TKO livers were stained with C3, C7, and E10 antibodies. Immunofluorescence images were merged with DAPI images. White arrows indicate early lesions. Bars: (A–D and E, top) 5 µm; (E, bottom) 50 µm.
Figure 3.
Figure 3.
HCC development is associated with an expansion of the progenitor compartment in TKO mice. (A) Representative FACS analysis (n = 4) of nonparenchymal cells 2 wk after Cre-mediated recombination in TKO mice compared with controls (CTRL). The nonhematopoietic fraction (CD45low) was analyzed for Sca1 and C3/C7/E10 expression. (B) Numbers of Sca1+ and C3/C7/E10+ cells in the nonparenchymal fractions of TKO livers (n = 4 for each genotype). (C) The expression of p130 was assessed by RT-qPCR in Sca1+ and C3/C7/E10+ subsets of control and TKO nonparenchymal cells (n = 3). (D) Cell cycle activity in TKO C3/C7/E10+ cells compared with TKO Sca1+ cells was measured by propidium iodide staining of fixed cells isolated by FACS (n = 4). (E) Expression of Bmi1 in Sca1+ and C3/C7/E10+ populations from control and TKO mice in early lesions, as assessed by RT-qPCR (n = 3). (F) Expression of Albumin and CK19 in C3/C7/E10+ or Sca1+ TKO cells (n = 3). (G) Colony-forming activity of unfractioned nonparenchymal cells from either control or TKO mice. Colonies were either grown in the presence or absence of EGF and HGF. Plates were stained with crystal violet after 8 d before counting (mean of four independent experiments). (H and I) Colony-forming activity of control and TKO Sca1+ and C3/C7/E10+ populations. Colony assay was performed in 24-well plates with sorted CTRL and TKO cells 2 wk after Cre-mediated recombination. (H) Representative pictures of colonies formed by C3/C7/E10+ (top) and Sca1+ (bottom) TKO cells. (I) Quantification of H. Colonies were fixed and stained after 8 d before counting (mean of three independent experiments). Error bars indicate SEM. *, P < 0.05; **, P < 0.01; ns, not significant.
Figure 4.
Figure 4.
Activation of cellular signaling pathways in TKO HCC cells. (A) Nonsupervised hierarchical clustering of datasets from various mouse HCC models (TKO, c-Myc overexpression, and E2F1 overexpression). Datasets from different platforms were first normalized before analysis (see Materials and methods). A cluster of genes specifically up-regulated in the TKO dataset was identified (cluster M; supplemental text). The color scale is drawn relative to each gene (each row) with blue representing the lowest expression and red the highest. (B) RT-qPCR of c-Myc expression in five control livers (CTRL) and nine TKO HCC samples. (C) GSEA shows a significant enrichment in the TKO dataset of a predefined gene list that is specific for a core Myc signature (Myc module). (D) GSEA analysis was performed by comparing the TKO dataset (Table S2) with the entire list of curated gene sets available. The entire list of gene sets enriched in the TKO dataset is displayed in Table S3. The gene sets (pathways) are ranked from the highest to the lowest score (NES: most significant, left). Significant p-value is <0.05, and significant FDR is <0.25. (E) The genes in cluster M were processed through DAVID analysis for GO annotations, and the top enrichment scores and p-values are shown. (F) RT-qPCR analysis of Notch1 and the Notch pathway target Nrarp in TKO HCCs compared with c-Myc–induced HCCs and control liver samples (n = 3). Error bars indicate SEM. *, P < 0.05; **, P < 0.01.
Figure 5.
Figure 5.
Notch signaling is regulated in HCC cells by E2F transcription factors. (A) RT-qPCR analysis was performed on five control livers (CTRL) and nine TKO HCC samples to detect the expression of members of the Notch pathway. (B) Reporter gene assays to measure the transactivation of the murine Hes1 promoter (left; light gray) and the human NOTCH1 promoter (right; gray) by 0.2 and 1 µg E2F1 or 1 µg E2F3. Data are representative of three independent experiments performed in Saos cells. (C–E) ChIP analysis for E2F1, E2F3 (activating E2Fs), and E2F4 (repressor E2F) binding to the promoter of members of the Notch pathway in a cell line derived from a TKO HCC (C), WT primary mouse liver cells (D), and a human HCC cell line, Hep3B (E). A p16 antibody was used as a negative control. Binding to the Cyclin A (Ccna2) promoter, a well-known E2F target, was used as a positive control. Displayed images are representative of three independent experiments. (F) Reintroduction of RB in mouse HCC cells. Two cell lines derived from TKO HCCs were transfected with a plasmid expressing GFP (empty vector) or a fusion protein composed of GFP and the large pocket domain of RB (RB reintroduction). GFP-positive cells were isolated by FACS 40 h after transfection, and the expression of Ccna2, Hey1, and Hes1 was assessed by RT-qPCR (n = 3). Error bars indicate SEM. *, P < 0.05; **, P < 0.01; ***, P < 0.001; ns, not significant.
Figure 6.
Figure 6.
The Notch signaling pathway inhibits the expansion of HCC cells. (A) Immunoblotting analysis of activated Notch1 (Notch1ICD) in three control livers (CTRL) and eight independent TKO tumors. GAPDH serves as a loading control. (B) H&E staining of liver sections from TKO mice treated with DAPT (n = 4) or vehicle control (n = 4). Bar, 50 µm. (C) Quantification of tumor area compared with the total area in DAPT- and vehicle-treated (Veh) TKO mice (n = 4). (D) Quantification of tumor numbers by surface area (n = 4). (E) Quantification of small and large tumors. The cutoff was arbitrarily set at 10,000 µm2, which corresponds to the size of early TKO lesions (n = 4). (F) Analysis of Nrarp mRNA levels in tumors upon DAPT treatment by RT-qPCR (n = 4). (G) Four HCC cell lines (two TKO cell lines, human cells SNU-449 and HepG2) were infected with MigR1-IRES-GFP retroviruses either empty (CTRL) or expressing NICD, and GFPhigh cells were isolated by FACS. (left) GFP expression in control and NICD-expressing cells. (right) Sorted cells were analyzed for propidium iodide incorporation and growth in culture. The number of cells was quantified 90 h after plating 20,000 cells. Data are representative of two independent experiments. (H) Five HCC cell lines (TKO1, TKO2, C3a, HepG2, and SNU-449) were infected with MigR1-IRES-GFP either empty (CTRL) or expressing NICD. GFPhigh cells were isolated by FACS and allowed to rest in culture for 72 h, after which survival was measured by Annexin V staining. Data are representative of two independent experiments. (I) C3/C7/E10+ nonparenchymal cells were FACS sorted, and 5,000 cells were plated in culture. Cells were infected with MigR1-IRES-GFP either empty (CTRL) or expressing NICD and counted 7 d after infection (n = 4). (J) The TKO dataset clusters with the subgroup B of human HCC after nonsupervised hierarchical clustering analysis of 3,497 mouse and human orthologues. (K) Nonsupervised hierarchical clustering of a curated gene set representing the Notch pathway (17 genes, including ligands, receptors, and target genes). Expression of Notch pathway genes was retrieved from a dataset of 53 primary human HCCs with good (group B) and bad (group A) prognosis. (L) A curated set of 17 genes in the Notch pathway (same as in K) predicts survival in HCC patients (OS, overall survival in months over a 5-yr period). Error bars indicate SEM. *, P < 0.05; **, P < 0.01; ***, P < 0.001.

References

    1. Benhamouche S., Curto M., Saotome I., Gladden A.B., Liu C.H., Giovannini M., McClatchey A.I. 2010. Nf2/Merlin controls progenitor homeostasis and tumorigenesis in the liver. Genes Dev. 24:1718–1730 10.1101/gad.1938710 - DOI - PMC - PubMed
    1. Boyault S., Rickman D.S., de Reyniès A., Balabaud C., Rebouissou S., Jeannot E., Hérault A., Saric J., Belghiti J., Franco D., et al. 2007. Transcriptome classification of HCC is related to gene alterations and to new therapeutic targets. Hepatology. 45:42–52 10.1002/hep.21467 - DOI - PubMed
    1. Burkhart D.L., Sage J. 2008. Cellular mechanisms of tumour suppression by the retinoblastoma gene. Nat. Rev. Cancer. 8:671–682 10.1038/nrc2399 - DOI - PMC - PubMed
    1. Burkhart D.L., Ngai L.K., Roake C.M., Viatour P., Thangavel C., Ho V.M., Knudsen E.S., Sage J. 2010. Regulation of RB transcription in vivo by RB family members. Mol. Cell. Biol. 30:1729–1745 10.1128/MCB.00952-09 - DOI - PMC - PubMed
    1. Caldwell S., Park S.H. 2009. The epidemiology of hepatocellular cancer: from the perspectives of public health problem to tumor biology. J. Gastroenterol. 44:96–101 10.1007/s00535-008-2258-6 - DOI - PubMed

Publication types

MeSH terms