. 2011 Sep 13;108(37):15324-9.
doi: 10.1073/pnas.1100255108. Epub 2011 Aug 29.

Inflammasome is a central player in the induction of obesity and insulin resistance

Affiliations

Inflammasome is a central player in the induction of obesity and insulin resistance

Rinke Stienstra et al. Proc Natl Acad Sci U S A. .

Abstract

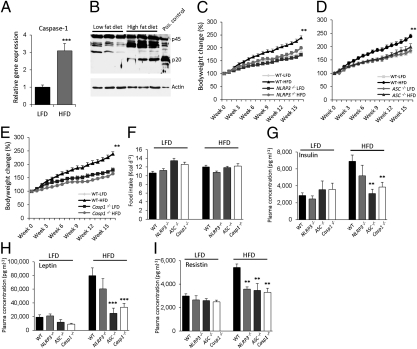
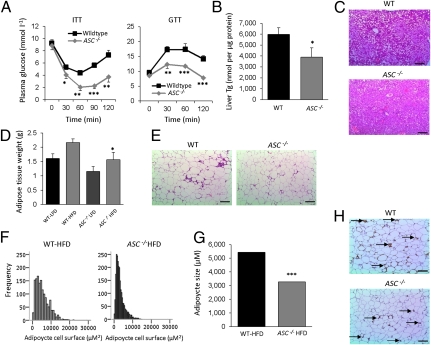
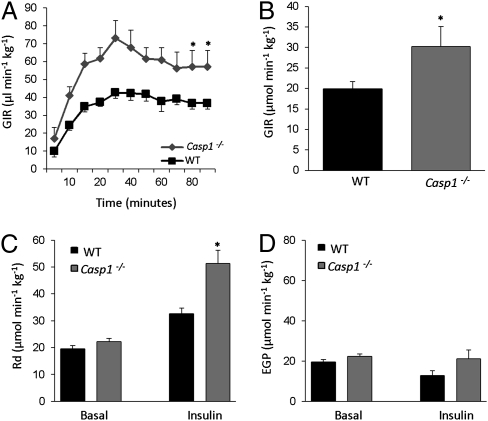
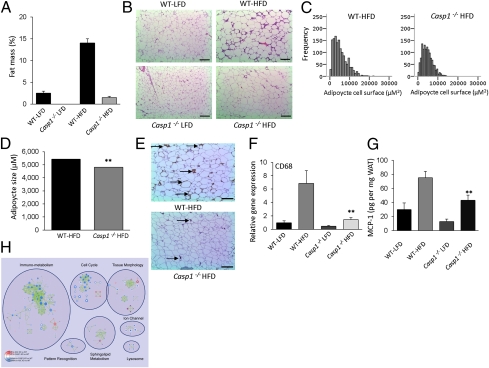
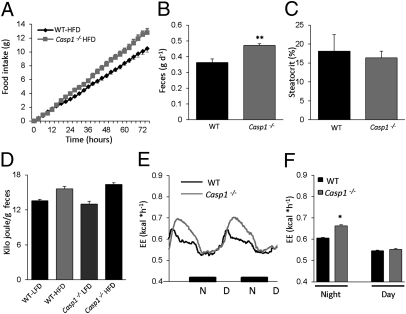
Inflammation plays a key role in the pathogenesis of obesity. Chronic overfeeding leads to macrophage infiltration in the adipose tissue, resulting in proinflammatory cytokine production. Both microbial and endogenous danger signals trigger assembly of the intracellular innate immune sensor Nlrp3, resulting in caspase-1 activation and production of proinflammatory cytokines IL-1β and IL-18. Here, we showed that mice deficient in Nlrp3, apoptosis-associated speck-like protein, and caspase-1 were resistant to the development of high-fat diet-induced obesity, which correlated with protection from obesity-induced insulin resistance. Furthermore, hepatic triglyceride content, adipocyte size, and macrophage infiltration in adipose tissue were all reduced in mice deficient in inflammasome components. Monocyte chemoattractant protein (MCP)-1 is a key molecule that mediates macrophage infiltration. Indeed, defective inflammasome activation was associated with reduced MCP-1 production in adipose tissue. Furthermore, plasma leptin and resistin that affect energy use and insulin sensitivity were also changed by inflammasome-deficiency. Detailed metabolic and molecular phenotyping demonstrated that the inflammasome controls energy expenditure and adipogenic gene expression during chronic overfeeding. These findings reveal a critical function of the inflammasome in obesity and insulin resistance, and suggest inhibition of the inflammasome as a potential therapeutic strategy.


Conflict of interest statement

The authors declare no conflict of interest.

Figures

Fig. 1.
Fig. 1.
Absence of the Nlrp3-inflammasome protects against the development of HFD-induced obesity. (A) qPCR analysis of caspase-1 gene expression levels in epididymal WAT of LFD- and HFD-fed wild-type C57/Bl6 animals after 16 wk of diet-intervention. (B) Caspase-1 protein levels in WAT of LFD- vs. HFD-fed wild-type animals. Comparison of bodyweight gain in wild-type, Nlrp3−/−(C), ASC−/− (D), and Casp1−/− (E) animals on LFD or HFD during 16 wk. (F) Daily food intake of wild-type, Nlrp3−/−, ASC−/−, and Casp1−/− animals fed a LFD or HFD. Plasma concentrations of insulin (G), leptin (H), and resistin (I) in LFD- and HFD-fed wild-type, Nlrp3−/−, ASC−/−, and Casp1−/− mice. **P < 0.01; ***P < 0.001; n = 6–8 mice per group. Error bars represent SEM.
Fig. 2.
Fig. 2.
ASC−/− animals are protected against HFD-induced insulin resistance, steatosis, and adipocyte hypertrophy. (A) Insulin tolerance test (ITT) and glucose tolerance tests (GTT) of HFD-fed wild-type and ASC−/− animals. (B) Liver triglyceride (Tg) levels in HFD-fed wild-type and ASC−/− mice. (C) Liver histology as determined by H&E staining. (Scale bars, 100 μm.) (D) Epididymal adipose tissue weight of LFD- and HFD-fed wild-type or ASC−/− mice. (E) Adipose tissue morphology after H&E staining of HFD-fed wild-type and ASC−/− mice. (Scale bars, 100 μm.) (F and G) Quantification of adipocyte size using software analysis. (H) Localization of macrophages in WAT of HFD-fed wild-type and ASC−/− at week 16. Arrow indicates macrophage specific immunoreaction. (Scale bars, 100 μm.)
Fig. 3.
Fig. 3.
Absence of caspase-1 protects against the development of HFD-induced insulin resistance as determined by hyperinsulinemic euglycemic clamp analysis. (A) Glucose infusion rates (GIR) during the euglycemic hyperinsulinemc clamp in HFD-fed wild-type and Casp1−/− animals. (B) Average glucose infusion rate of wild-type and Casp1−/− animals fed a HFD for 16 wk. (C) Rate of disappearance (Rd), a measure of peripheral glucose uptake in wild-type and Casp1−/− animals. (D) Endogenous (hepatic) glucose production (EGP) during the clamp. Mice were maintained on a HFD during 16 wk before the clamp experiment. *P < 0.05; n = 6–8 mice per group. Error bars represent SEM.
Fig. 4.
Fig. 4.
HFD-fed Casp1−/− animals are protected against obesity-induced adipocyte hypertrophy and macrophage influx into the adipose. (A) Total percentage of WAT as determined by DEXA-scan analysis of wild-type and Casp1−/− on LFD or HFD for 16 wk. (B) Histology as determined by H&E staining of WAT. (Scale bars, 100 μm.) (C and D) Software analysis of adipocyte size (C) and quantification (D). (E) Macrophage influx into the WAT as determined by immunohistochemistry. Arrow indicates macrophage specific immunoreaction. (Scale bars, 100 μm.) (F) qPCR analysis of the macrophage marker CD68 in white adipose tissue. (G) Concentration of MCP-1 in adipose tissue. (H) Enrichment map for gene expression in WAT of Casp-1−/− (n = 3) (inner node area) and ASC−/− (n = 3) (node borders) compared with WT (n = 4) at 16 wk after HFD intervention. Nodes represent functional gene sets, and edges between nodes their similarity. Color intensity of node area or border is proportional to enrichment significance in Casp-1−/− or ASC−/− mice compared with wild-type; red indicates increased and blue suppressed gene sets in null mice compared with wild-type. Node size represents the gene set size, and edge thickness represent degree of overlap between two connected gene sets. Clusters were manually circled and labeled to highlight the prevalent biological functions among related gene sets. **P < 0.01; n = 6–8 mice per group. Error bars represent SEM.
Fig. 5.
Fig. 5.
Increased energy expenditure without any changes in net energy intake in HFD-fed Casp1−/− mice 16 wk. (A) Cumulative food intake of HFD-fed animals. (B) Fecal output in HFD-fed wild-type and Casp1−/− animals. (C) Fat content of feces from HFD-fed wild-type and Casp1−/− animals as determined by steatocrit measurement. (D) Caloric content of feces from wild-type and Casp1−/− animals determined by bomb calorimetry. (E and F) Energy expenditure of HFD-fed wild-type and Casp1−/− mice. *P < 0.05; **P < 0.01; n = 6–8 mice per group. Error bars represent SEM.

References

    1. Ye Z, Ting JP. NLR, the nucleotide-binding domain leucine-rich repeat containing gene family. Curr Opin Immunol. 2008;20(1):3–9. - PubMed
    1. Kanneganti TD, et al. Bacterial RNA and small antiviral compounds activate caspase-1 through cryopyrin/Nalp3. Nature. 2006;440:233–236. - PubMed
    1. Sutterwala FS, et al. Critical role for NALP3/CIAS1/Cryopyrin in innate and adaptive immunity through its regulation of caspase-1. Immunity. 2006;24:317–327. - PubMed
    1. Mariathasan S, et al. Cryopyrin activates the inflammasome in response to toxins and ATP. Nature. 2006;440:228–232. - PubMed
    1. Duewell P, et al. NLRP3 inflammasomes are required for atherogenesis and activated by cholesterol crystals. Nature. 2010;464:1357–1361. - PMC - PubMed

Publication types

MeSH terms

Associated data