

Reconstruction of a 1,910-y-long locust series reveals consistent associations with climate fluctuations in China
- PMID: 21876131
- PMCID: PMC3167559
- DOI: 10.1073/pnas.1100189108
Reconstruction of a 1,910-y-long locust series reveals consistent associations with climate fluctuations in China
Abstract
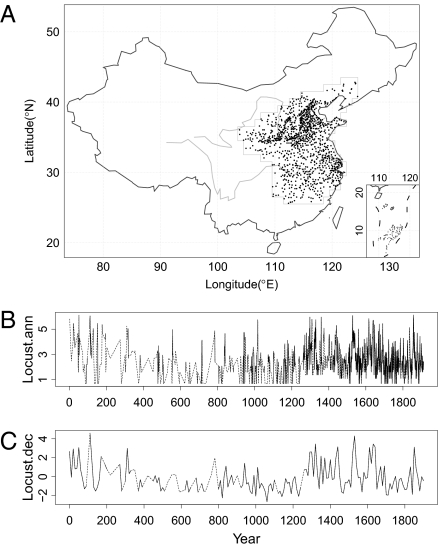
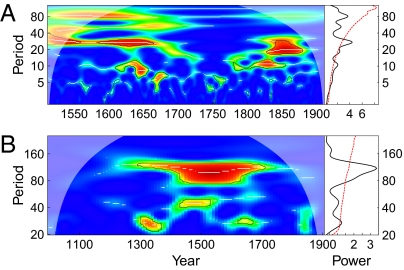
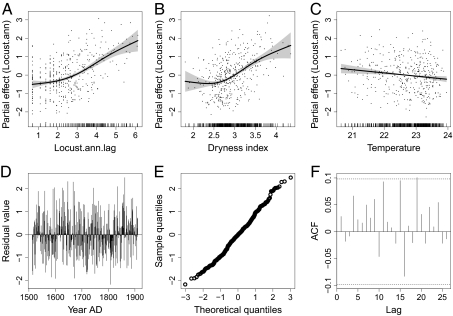
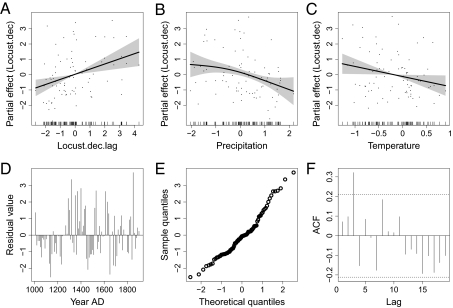
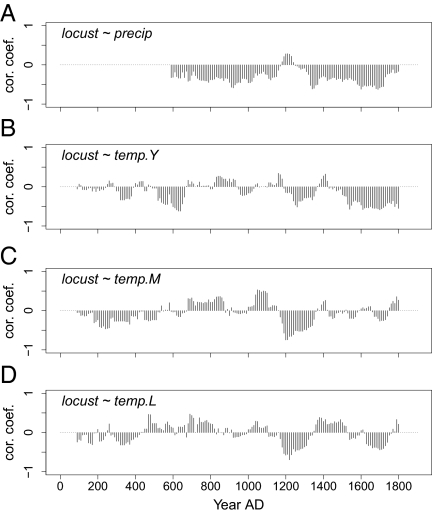
It is becoming increasingly clear that global warming is taking place; however, its long-term effects on biological populations are largely unknown due to lack of long-term data. Here, we reconstructed a 1,910-y-long time series of outbreaks of Oriental migratory locusts (Locusta migratoria manilensis) in China, on the basis of information extracted from >8,000 historical documents. First by analyzing the most recent period with the best data quality using generalized additive models, we found statistically significant associations between the reconstructed locust abundance and indexes of precipitation and temperature at both annual (A.D. 1512-1911) and decadal (A.D. 1000-1900) scales: There were more locusts under dry and cold conditions and when locust abundance was high in the preceding year or decade. Second, by exploring locust-environment correlations using a 200-y moving window, we tested whether these associations also hold further back in time. The locust-precipitation correlation was found to hold at least as far back as to A.D. 500, supporting the robustness of this link as well as the quality of both reconstructions. The locust-temperature correlation was weaker and less consistent, which may reflect this link being indirect and thus more easily moderated by other factors. We anticipate that further analysis of this unique time series now available to the scientific community will continue to provide insights into biological consequences of climate change in the years to come.
Conflict of interest statement
The authors declare no conflict of interest.
Figures
References
-
- Guo F, Chen Y, Lu B. The Biology of the Migratory Locusts in China. Jinan, China: Shandong Science and Technology Press; 1991. Chinese.
-
- Fan Y. Locust in yin dynasty. Agric Archaeol. 1983;4:314–317.
-
- Chen M, Jiang T. Complete Collection of Illustrations and Writings from the Earliest to Current Times. Beijing: Ying wu dian; 1728. Chinese.
-
- Chen J. Outbreaks of locust recorded in Chinese literatures. Annu Zhejiang Entomol Bureau. 1936;5:188–241.
-
- Chen G. China Successive Natural and Manmade Disasters Table. Guangzhou, China: Jinan University Book Series; 1939. Chinese.
Publication types
MeSH terms
LinkOut - more resources
Full Text Sources
Other Literature Sources
Medical
Molecular Biology Databases
