

Formation of plant metabolic gene clusters within dynamic chromosomal regions
- PMID: 21876149
- PMCID: PMC3179108
- DOI: 10.1073/pnas.1109273108
Formation of plant metabolic gene clusters within dynamic chromosomal regions
Abstract
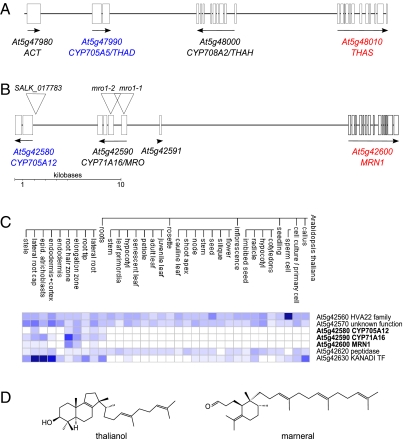
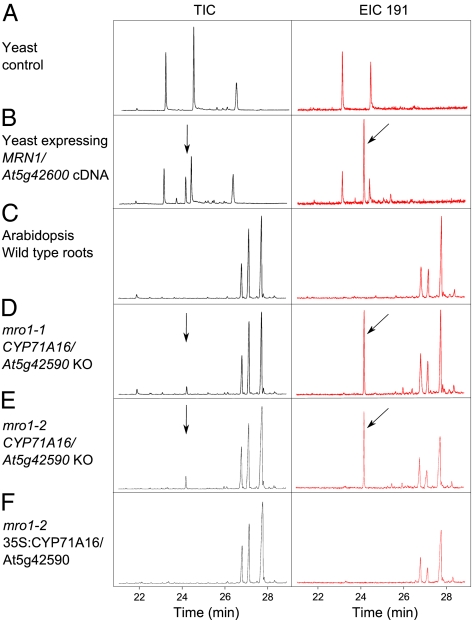
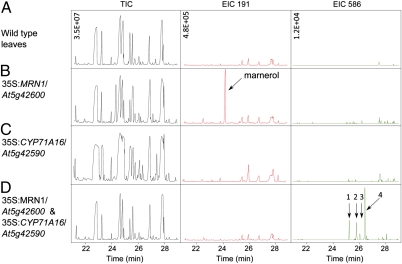
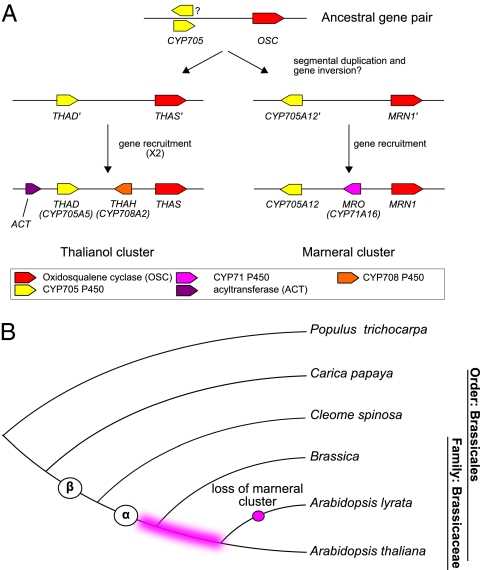
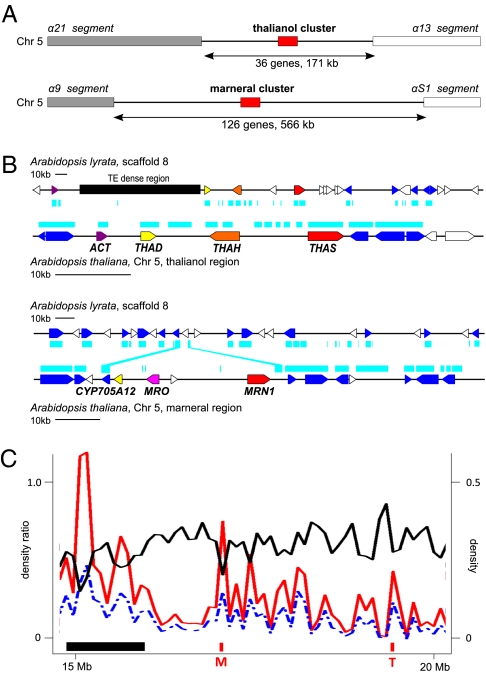
In bacteria, genes with related functions often are grouped together in operons and are cotranscribed as a single polycistronic mRNA. In eukaryotes, functionally related genes generally are scattered across the genome. Notable exceptions include gene clusters for catabolic pathways in yeast, synthesis of secondary metabolites in filamentous fungi, and the major histocompatibility complex in animals. Until quite recently it was thought that gene clusters in plants were restricted to tandem duplicates (for example, arrays of leucine-rich repeat disease-resistance genes). However, operon-like clusters of coregulated nonhomologous genes are an emerging theme in plant biology, where they may be involved in the synthesis of certain defense compounds. These clusters are unlikely to have arisen by horizontal gene transfer, and the mechanisms behind their formation are poorly understood. Previously in thale cress (Arabidopsis thaliana) we identified an operon-like gene cluster that is required for the synthesis and modification of the triterpene thalianol. Here we characterize a second operon-like triterpene cluster (the marneral cluster) from A. thaliana, compare the features of these two clusters, and investigate the evolutionary events that have led to cluster formation. We conclude that common mechanisms are likely to underlie the assembly and control of operon-like gene clusters in plants.
Conflict of interest statement
The authors declare no conflict of interest.
Figures
Similar articles
-
Metabolic diversification--independent assembly of operon-like gene clusters in different plants.Science. 2008 Apr 25;320(5875):543-7. doi: 10.1126/science.1154990. Epub 2008 Mar 20. Science. 2008. PMID: 18356490
-
Prediction of operon-like gene clusters in the Arabidopsis thaliana genome based on co-expression analysis of neighboring genes.Gene. 2012 Jul 15;503(1):56-64. doi: 10.1016/j.gene.2012.04.043. Epub 2012 Apr 24. Gene. 2012. PMID: 22561113
-
Identification of marneral synthase, which is critical for growth and development in Arabidopsis.Plant J. 2012 Dec;72(5):791-804. doi: 10.1111/j.1365-313X.2012.05120.x. Epub 2012 Oct 1. Plant J. 2012. PMID: 22882494
-
The rise of operon-like gene clusters in plants.Trends Plant Sci. 2014 Jul;19(7):447-59. doi: 10.1016/j.tplants.2014.01.013. Epub 2014 Feb 27. Trends Plant Sci. 2014. PMID: 24582794 Review.
-
Operons.Cell Mol Life Sci. 2009 Dec;66(23):3755-75. doi: 10.1007/s00018-009-0114-3. Epub 2009 Aug 7. Cell Mol Life Sci. 2009. PMID: 19662496 Free PMC article. Review.
Cited by
-
Tyrosylprotein sulfotransferase-dependent and -independent regulation of root development and signaling by PSK LRR receptor kinases in Arabidopsis.J Exp Bot. 2021 Jul 28;72(15):5508-5521. doi: 10.1093/jxb/erab233. J Exp Bot. 2021. PMID: 34028532 Free PMC article.
-
Functional Operons in Secondary Metabolic Gene Clusters in Glarea lozoyensis (Fungi, Ascomycota, Leotiomycetes).mBio. 2015 Jun 16;6(3):e00703. doi: 10.1128/mBio.00703-15. mBio. 2015. PMID: 26081635 Free PMC article.
-
Rethinking the evolution of eukaryotic metabolism: novel cellular partitioning of enzymes in stramenopiles links serine biosynthesis to glycolysis in mitochondria.BMC Evol Biol. 2017 Dec 4;17(1):241. doi: 10.1186/s12862-017-1087-8. BMC Evol Biol. 2017. PMID: 29202688 Free PMC article.
-
Synthetic Botany.Cold Spring Harb Perspect Biol. 2017 Jul 5;9(7):a023887. doi: 10.1101/cshperspect.a023887. Cold Spring Harb Perspect Biol. 2017. PMID: 28246181 Free PMC article. Review.
-
A high-quality genome assembly of the tetraploid Teucrium chamaedrys unveils a recent whole-genome duplication and a large biosynthetic gene cluster for diterpenoid metabolism.Plant Commun. 2025 Aug 11;6(8):101393. doi: 10.1016/j.xplc.2025.101393. Epub 2025 Jun 3. Plant Commun. 2025. PMID: 40468595 Free PMC article.
References
-
- Blumenthal T, Gleason KS. Caenorhabditis elegans operons: Form and function. Nat Rev Genet. 2003;4:110–118. - PubMed
-
- Hurst LD, Pál C, Lercher MJ. The evolutionary dynamics of eukaryotic gene order. Nat Rev Genet. 2004;5:299–310. - PubMed
-
- Field B, Osbourn A. Operons. Nat Chem Biol. 2010;6 10.1038/nchembio.359.
-
- Horton R, et al. Gene map of the extended human MHC. Nat Rev Genet. 2004;5:889–899. - PubMed
Publication types
MeSH terms
Substances
Grants and funding
LinkOut - more resources
Full Text Sources
Other Literature Sources
Molecular Biology Databases
