. 2011 Sep 13;108(37):15456-61.
doi: 10.1073/pnas.1106862108. Epub 2011 Aug 29.

Mitochondrial matrix Ca2+ as an intrinsic signal regulating mitochondrial motility in axons

Affiliations

Mitochondrial matrix Ca2+ as an intrinsic signal regulating mitochondrial motility in axons

Karen T Chang et al. Proc Natl Acad Sci U S A. .

Abstract

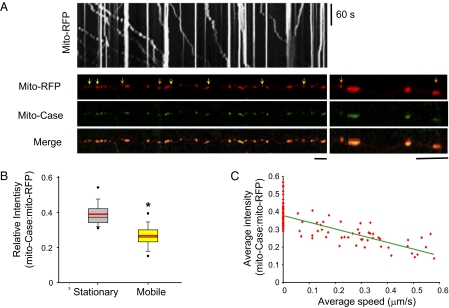
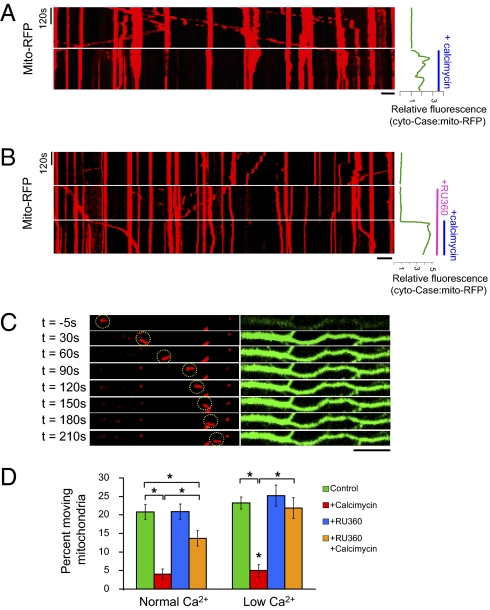
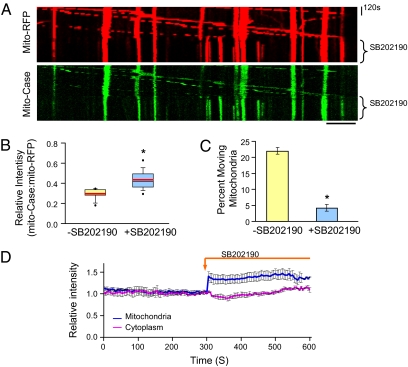
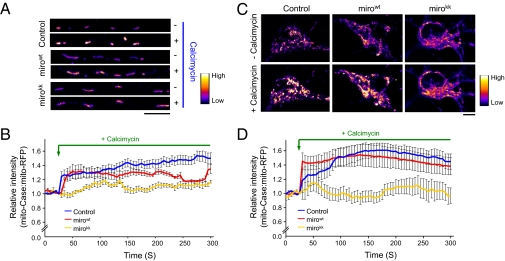
The proper distribution of mitochondria is particularly vital for neurons because of their polarized structure and high energy demand. Mitochondria in axons constantly move in response to physiological needs, but signals that regulate mitochondrial movement are not well understood. Aside from producing ATP, Ca(2+) buffering is another main function of mitochondria. Activities of many enzymes in mitochondria are also Ca(2+)-dependent, suggesting that intramitochondrial Ca(2+) concentration is important for mitochondrial functions. Here, we report that mitochondrial motility in axons is actively regulated by mitochondrial matrix Ca(2+). Ca(2+) entry through the mitochondrial Ca(2+) uniporter modulates mitochondrial transport, and mitochondrial Ca(2+) content correlates inversely with the speed of mitochondrial movement. Furthermore, the miro1 protein plays a role in Ca(2+) uptake into the mitochondria, which subsequently affects mitochondrial movement.


Conflict of interest statement

The authors declare no conflict of interest.

Figures

Fig. 1.
Fig. 1.
Moving mitochondria tend to have lower mitochondrial Ca2+ signal. (A) Kymograph generated from moving mitochondria (Upper) and first frame of live imaging of neuron cotransfected with mito-RFP and mito-Case12. Arrows point to moving mitochondria (yellow and orange) and the region magnified on the right is denoted by the orange arrows. (Scale bars, 10 μm.) (B) Box plot of the mito-Case12:mito-RFP ratio for stationary and mobile mitochondria. Lower and upper boundaries of the box indicate 25th and 75th percentiles, respectively. The black line in the box represents the median, and the red line represents the mean. Whiskers show 10th and 90th percentiles. Dots above and below the box are showing outliers. *P = 2 × 10⁻¹⁵ (C) Average mito-Case12:mito-RFP ratio versus average speed of movement. R2 = 0.58. n > 150 mitochondria from 10 axons for B and C.
Fig. 2.
Fig. 2.
Blocking Ca2+ influx into mitochondria through Ca2+-uniporter delays calcimycin-induced arrest in mitochondrial movement. (A) Kymograph of a neuron cotransfected with mito-RFP and cyto-Case12 before and after addition of calcimycin (2 μg/mL). The rise in Ca2+ is plotted on the right, shown as relative fluorescence of cyto-Case12:mito-RFP ratio. Immediately after calcimycin treatment and Ca2+ elevation, mobile mitochondria became stationary. (B) Kymograph showing mitochondrial movement for neurons cotransfected with mito-RFP and cyto-Case12. Relative intensity of cyto-Case12:mito-RFP is shown on the right following RU360 and calcimycin treatments. Ru360 was applied for 15 min before addition of calcimycin, but only the last 5 min of RU360 treatment is shown. (C) Mito-RFP (red; Left) and cyto-Case12 (green; Right) images after 15 min of RU360 and before (t = −5 s) and after calcimycin treatment. Despite increase in cytoplasmic Ca2+, mitochondria remained mobile (highlighted by yellow circle). (Scale bars in A–C, 10 μm.) (D) Percentage of moving mitochondria over the 5-min imaging period for each condition. Normal Ca2+ indicates 1.8 mM Ca2+ and low calcium indicates 0.18 mM Ca2+ in the extracellular solution. n = 150–380 mitochondria from at least five axons analyzed. Values represent mean ± SEM; *P < 0.01.
Fig. 3.
Fig. 3.
Mitochondrial Ca2+ elevation by activating the mitochondrial Ca2+ uniporter is sufficient to stop mitochondrial movement. (A) Kymograph of time-lapse images of neuron cotransfected with mito-RFP and mito-Case12 before and after SB202190. (Scale bar, 10 μm.) (B) Box plot of mito-Case:mito-RFP intensity ratio before and after SB202190 for the moving mitochondria. n = 40 moving mitochondria from eight axons. Red lines indicate mean. *P = 6 × 10⁻⁶. (C) Percentage of moving mitochondria before and after SB202190 treatment. n = 200 mitochondria from eight axons. *P = 9 × 10⁻¹⁰. (D) SB202190 treatment did not alter cytoplasmic Ca2+ level. Relative intensity before and after SB202190 treatment in cytoplasm is measure by Cyto-Case12, and intensity in mitochondria is measured by mito-Case12. To normalize for drifts in z axis during imaging, values were normalized to mito-RFP. Values represent mean ± SEM, n = 8 axons.
Fig. 4.
Fig. 4.
Mutations in miro1 EF hand domains reduce mitochondrial Ca2+ elevation following calcimycin treatment. (A and C) Representative images of mito-Case12 level (pseudocolored) before and after calcimycin treatment in axon and soma, respectively. (Scale bars, 10 μm.) (B and D) Mito-Case12:mito-RFP ratio before and after calcimycin treatment in axon and soma, respectively. Mirokk mutant decreased the level of Ca2+ entering mitochondria. Values represent mean ± SEM. (A and B) n = 6 axons each; (C and D), n = 6 cell bodies each.

Similar articles

Cited by

References

    1. Hollenbeck PJ, Saxton WM. The axonal transport of mitochondria. J Cell Sci. 2005;118:5411–5419. - PMC - PubMed
    1. Chang DTW, Reynolds IJ. Mitochondrial trafficking and morphology in healthy and injured neurons. Prog Neurobiol. 2006;80:241–268. - PubMed
    1. Mattson MP, Gleichmann M, Cheng A. Mitochondria in neuroplasticity and neurological disorders. Neuron. 2008;60:748–766. - PMC - PubMed
    1. Hollenbeck PJ. The pattern and mechanism of mitochondrial transport in axons. Front Biosci. 1996;1:d91–d102. - PubMed
    1. Ligon LA, Steward O. Movement of mitochondria in the axons and dendrites of cultured hippocampal neurons. J Comp Neurol. 2000;427:340–350. - PubMed

Publication types

LinkOut - more resources