. 2011 Sep 13;108(37):15420-5.
doi: 10.1073/pnas.1112355108. Epub 2011 Aug 29.

Dendritic coding of multiple sensory inputs in single cortical neurons in vivo

Affiliations

Dendritic coding of multiple sensory inputs in single cortical neurons in vivo

Zsuzsanna Varga et al. Proc Natl Acad Sci U S A. .

Abstract

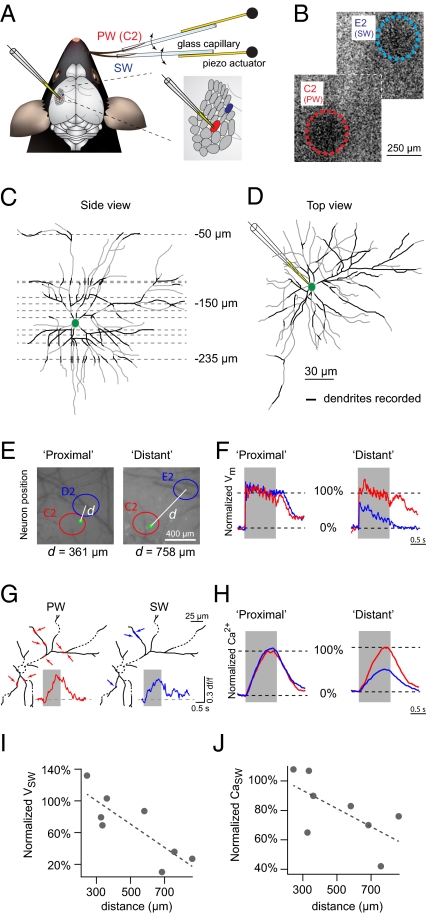
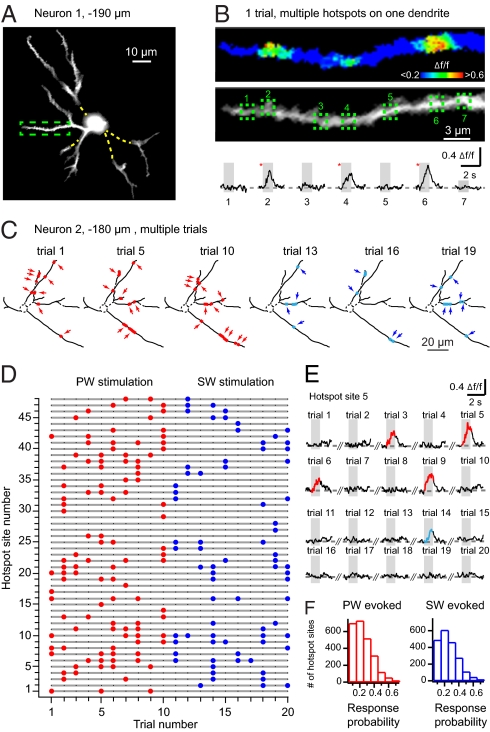
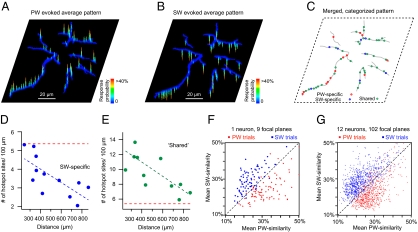
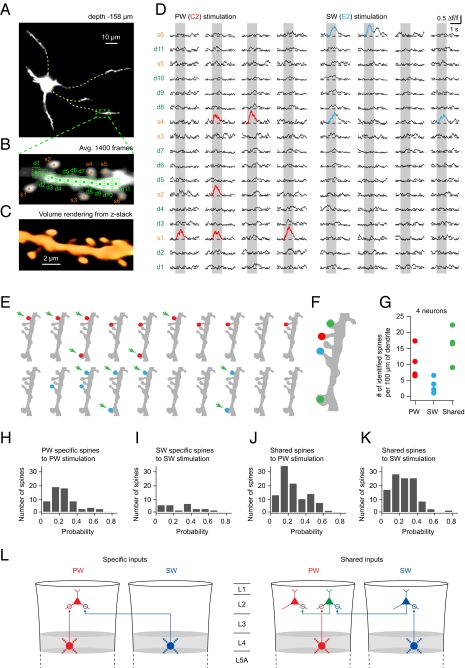
Single cortical neurons in the mammalian brain receive signals arising from multiple sensory input channels. Dendritic integration of these afferent signals is critical in determining the amplitude and time course of the neurons' output signals. As of yet, little is known about the spatial and temporal organization of converging sensory inputs. Here, we combined in vivo two-photon imaging with whole-cell recordings in layer 2 neurons of the mouse vibrissal cortex as a means to analyze the spatial pattern of subthreshold dendritic calcium signals evoked by the stimulation of different whiskers. We show that the principle whisker and the surrounding whiskers can evoke dendritic calcium transients in the same neuron. Distance-dependent attenuation of dendritic calcium transients and the corresponding subthreshold depolarization suggest feed-forward activation. We found that stimulation of different whiskers produced multiple calcium hotspots on the same dendrite. Individual hotspots were activated with low probability in a stochastic manner. We show that these hotspots are generated by calcium signals arising in dendritic spines. Some spines were activated uniquely by single whiskers, but many spines were activated by multiple whiskers. These shared spines indicate the existence of presynaptic feeder neurons that integrate and transmit activity arising from multiple whiskers. Despite the dendritic overlap of whisker-specific and shared inputs, different whiskers are represented by a unique set of activation patterns within the dendritic field of each neuron.


Conflict of interest statement

The authors declare no conflict of interest.

Figures

Fig. 1.
Fig. 1.
In vivo two-photon imaging of whisker stimulation-evoked subthreshold dendritic calcium signals. (A) Overview of the experiment design. (B) Intrinsic signal optical imaging to locate whisker-related columns. The map is a montage of two intrinsic optical images. (C) Side view of a level 2/3 neuron. Black lines indicate dendrites recorded with calcium imaging, and dashed lines indicate depth of focal planes. (D) Top view of the same neuron as in C. (E) Example neurons with different distances from the SW column center. Red and blue circles represent PW and SW columns, respectively; the green dot indicates a neuron, and the white line (d) indicates the distance between the neuron and SW column. (F) Whisker stimulation-evoked average (n = 100) subthreshold depolarization normalized to the average value of PW response (absolute mean amplitude for proximal = 3.9 mV, absolute mean amplitude for distant = 4.2 mV). Red and blue traces represent PW- and SW-evoked responses, respectively; gray shading indicates stimulation time window. Traces are from the same neurons as in E. The same notations apply for G and H. (G) Examples of PW- and SW-evoked dendritic calcium signals. Arrows indicate calcium signaling sites, and dashed lines indicate dendritic portions out of the focal plane. (H) Normalized global dendritic calcium signals of neurons shown in E. Note that corresponding recordings in F and H were obtained simultaneously; both recorded neurons were hyperpolarized by 2 mV to prevent action potential firing. (I) Normalized SW-evoked depolarization amplitude plotted against distance. Each point represents one neuron. Dashed line represents linear fitting. (J) Normalized SW-evoked global dendritic calcium signal amplitude plotted against distance. Notations are same as in I.
Fig. 2.
Fig. 2.
Spatial and temporal organization of dendritic calcium hotspots. (A) Two-photon image of a layer 2 neuron (Alexa channel, average of 280 frames). Yellow dashed lines represent dendrites out of focus, and the green dashed box indicates the dendrite shown in B. (B Top) Pseudocolor image of the relative fluorescent change in the Oregon Green channel of the dendrite marked in A (projection of 1 s). (B Middle) Average grayscale image of 280 frames in the Oregon Green channel. Green dashed boxes are regions of interest (ROIs) on the dendrite. (B Bottom) Calcium transients calculated from the ROIs indicated in Middle. Red asterisks indicate ROIs activated by stimulation, and gray shading represents the stimulation time window. (C) Examples of dendritic hotspot activation patterns for 3–3 trials evoked by PW and SW stimulation. Red and blue dots highlighted by arrows represent hotspot sites activated by PW and SW, respectively. (D) Graph of the active hotspot sites in the same focal plane as C. Red and blue dots indicate hotspots sites activated by the PW and SW, respectively. (E) Example of whisker-evoked calcium signals in consecutive trials. Red and blue traces represent calcium transients evoked by PW and SW, respectively; gray shading represents stimulation time window. (F) Histograms of the response probability for all hotspots sites in all neurons.
Fig. 3.
Fig. 3.
Distinct dendritic representation of multiple whiskers through specific and shared hotspot sites. (A and B) Weighted mapping of PW- (A) and SW- (B) evoked hotspot sites in the same focal plane. Color-coded peaks and valleys represent the response probability of hotspot sites for PW and SW stimulation, respectively. (C) Merged mapping of PW-specific (red), SW-specific (blue), and shared (green) hotspot sites. (D and E) The number of SW-specific (D) and shared (E) hotspot sites depends on the distance between the neuron and the SW column. Each point represents one neuron. Blue and green dashed lines are linear fitting of the number of SW-specific and shared hotspot sites vs. distance, respectively. The red dashed line represents the average number of PW-specific hotspot sites (the correlation between the number of PW-specific hotspot sites and distance was not significant). (F and G) Intertrial pattern correlation for all focal planes in one neuron (F) and in all 12 neurons (G). Each point represents one trial, where the x coordinate is the average of pattern correlation value to all of the other PW trials of the same focal plane and the y coordinate is the average of pattern correlation value to all of the other SW trials. The dashed line represents the criterion of judgment for the classifier.
Fig. 4.
Fig. 4.
Multiple peripheral sensory input channels converge on single shared spines. (A) Two-photon image of a layer 2 neuron that was recorded in full frame at 40 Hz and averages 280 frames. Yellow dashed lines represent dendrites out of focus, and the green dashed box indicates the portion of dendrite shown in B. (B) Two-photon image of a dendrite portion (average of 1,400 frames) recorded in partial frame at 200 Hz (Materials and Methods). Green boxes with dots and orange dots indicate dendritic segments and spines from which calcium signals were calculated, respectively. (C) Top view of the volume rendering of the same dendrite. (D) Calcium signals from single spines and dendritic segments as marked in B. Red and blue traces represent identified calcium transients in spines evoked by PW and SW, respectively; gray shading represents stimulation time window. (E) Spine activation patterns in consecutive trials. Red and blue dots indicate spines activated by PW and SW, respectively; green arrows indicate spines activated by both whiskers. (F) Categorization of the spines in E. Red, PW-specific; blue, SW-specific; green, shared. (G) Number of responsive spines per dendrite length. (H–K) Histograms of the response probability of spines in different categories. (L) Scheme of the candidate presynaptic sources of PW-specific, SW-specific, and shared inputs.

Similar articles

Cited by

References

    1. Cajal SRY. Histology of the Nervous System of Man and Vertebrates. London: Oxford University Press; 1994.
    1. Lichtman JW, Livet J, Sanes JR. A technicolour approach to the connectome. Nat Rev Neurosci. 2008;9:417–422. - PMC - PubMed
    1. Denk W, Horstmann H. Serial block-face scanning electron microscopy to reconstruct three-dimensional tissue nanostructure. PLoS Biol. 2004;2:e329. - PMC - PubMed
    1. DeFalco J, et al. Virus-assisted mapping of neural inputs to a feeding center in the hypothalamus. Science. 2001;291:2608–2613. - PubMed
    1. Feldmeyer D, Lübke J, Sakmann B. Efficacy and connectivity of intracolumnar pairs of layer 2/3 pyramidal cells in the barrel cortex of juvenile rats. J Physiol. 2006;575:583–602. - PMC - PubMed