

Categorizing biases in high-confidence high-throughput protein-protein interaction data sets
- PMID: 21876202
- PMCID: PMC3237088
- DOI: 10.1074/mcp.M111.012500
Categorizing biases in high-confidence high-throughput protein-protein interaction data sets
Abstract
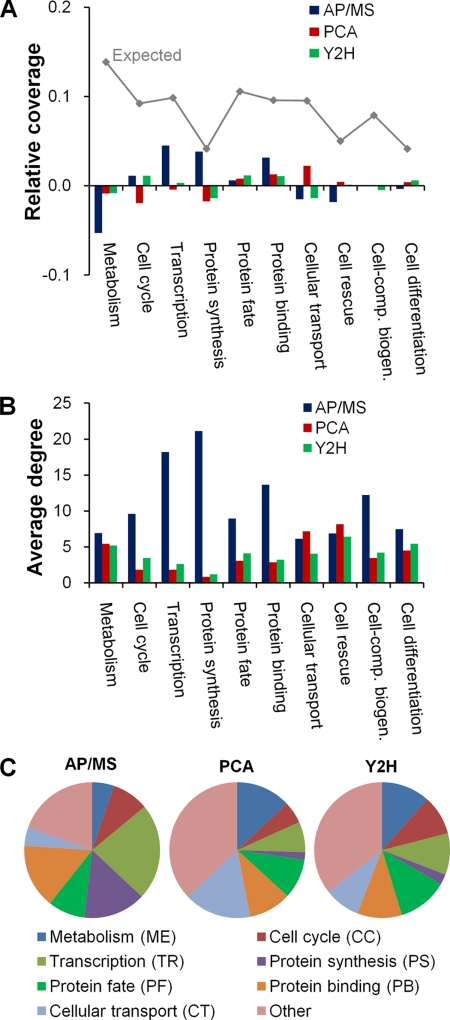
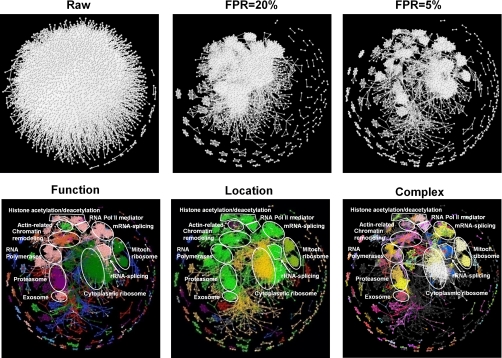
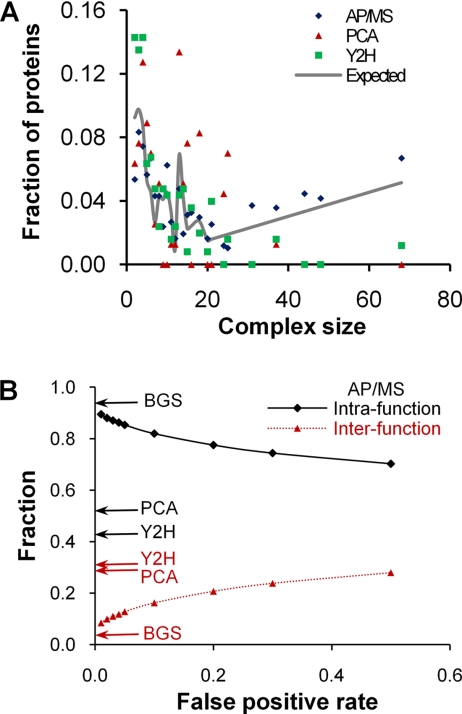
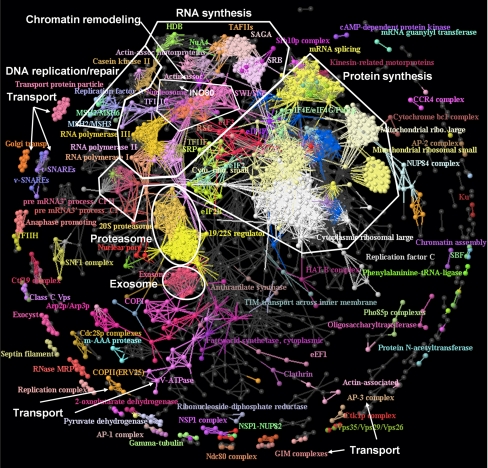
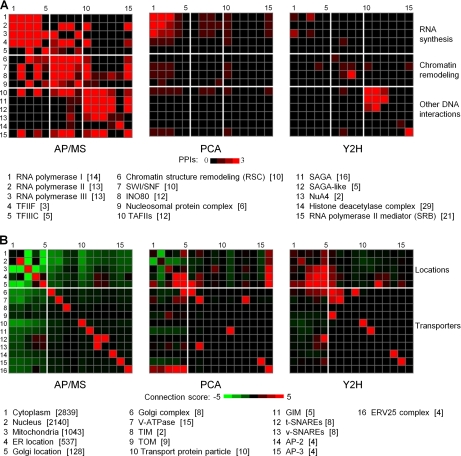
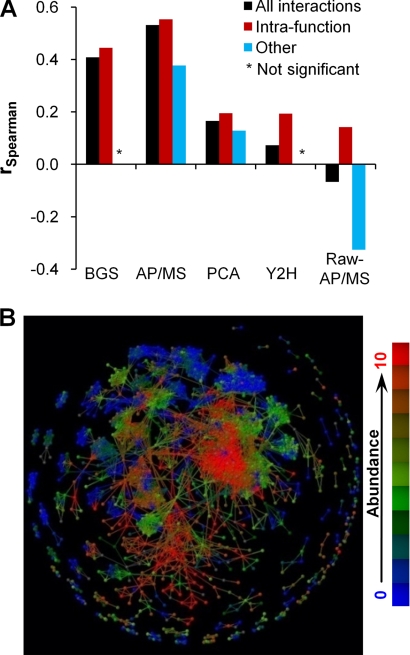
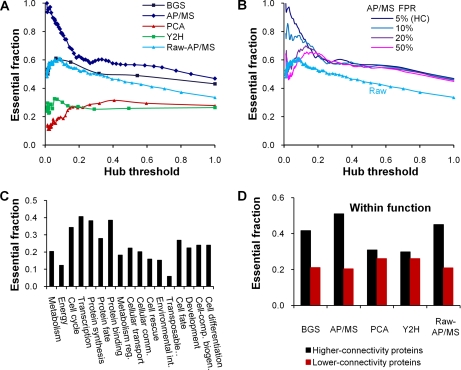
We characterized and evaluated the functional attributes of three yeast high-confidence protein-protein interaction data sets derived from affinity purification/mass spectrometry, protein-fragment complementation assay, and yeast two-hybrid experiments. The interacting proteins retrieved from these data sets formed distinct, partially overlapping sets with different protein-protein interaction characteristics. These differences were primarily a function of the deployed experimental technologies used to recover these interactions. This affected the total coverage of interactions and was especially evident in the recovery of interactions among different functional classes of proteins. We found that the interaction data obtained by the yeast two-hybrid method was the least biased toward any particular functional characterization. In contrast, interacting proteins in the affinity purification/mass spectrometry and protein-fragment complementation assay data sets were over- and under-represented among distinct and different functional categories. We delineated how these differences affected protein complex organization in the network of interactions, in particular for strongly interacting complexes (e.g. RNA and protein synthesis) versus weak and transient interacting complexes (e.g. protein transport). We quantified methodological differences in detecting protein interactions from larger protein complexes, in the correlation of protein abundance among interacting proteins, and in their connectivity of essential proteins. In the latter case, we showed that minimizing inherent methodology biases removed many of the ambiguous conclusions about protein essentiality and protein connectivity. We used these findings to rationalize how biological insights obtained by analyzing data sets originating from different sources sometimes do not agree or may even contradict each other. An important corollary of this work was that discrepancies in biological insights did not necessarily imply that one detection methodology was better or worse, but rather that, to a large extent, the insights reflected the methodological biases themselves. Consequently, interpreting the protein interaction data within their experimental or cellular context provided the best avenue for overcoming biases and inferring biological knowledge.
Figures

Similar articles
-
Analyzing yeast protein-protein interaction data obtained from different sources.Nat Biotechnol. 2002 Oct;20(10):991-7. doi: 10.1038/nbt1002-991. Nat Biotechnol. 2002. PMID: 12355115
-
Inferring physical protein contacts from large-scale purification data of protein complexes.Mol Cell Proteomics. 2011 Jun;10(6):M110.004929. doi: 10.1074/mcp.M110.004929. Epub 2011 Mar 30. Mol Cell Proteomics. 2011. PMID: 21451165 Free PMC article.
-
A high-accuracy consensus map of yeast protein complexes reveals modular nature of gene essentiality.BMC Bioinformatics. 2007 Jul 2;8:236. doi: 10.1186/1471-2105-8-236. BMC Bioinformatics. 2007. PMID: 17605818 Free PMC article.
-
Profiling of protein interaction networks of protein complexes using affinity purification and quantitative mass spectrometry.Mol Cell Proteomics. 2010 Aug;9(8):1650-65. doi: 10.1074/mcp.R110.000265. Epub 2010 May 5. Mol Cell Proteomics. 2010. PMID: 20445003 Free PMC article. Review.
-
Challenges and rewards of interaction proteomics.Mol Cell Proteomics. 2009 Jan;8(1):3-18. doi: 10.1074/mcp.R800014-MCP200. Epub 2008 Sep 17. Mol Cell Proteomics. 2009. PMID: 18799807 Review.
Cited by
-
"Guilt by association" is the exception rather than the rule in gene networks.PLoS Comput Biol. 2012;8(3):e1002444. doi: 10.1371/journal.pcbi.1002444. Epub 2012 Mar 29. PLoS Comput Biol. 2012. PMID: 22479173 Free PMC article.
-
Diversity in genetic in vivo methods for protein-protein interaction studies: from the yeast two-hybrid system to the mammalian split-luciferase system.Microbiol Mol Biol Rev. 2012 Jun;76(2):331-82. doi: 10.1128/MMBR.05021-11. Microbiol Mol Biol Rev. 2012. PMID: 22688816 Free PMC article. Review.
-
Pooled PPIseq: Screening the SARS-CoV-2 and human interface with a scalable multiplexed protein-protein interaction assay platform.PLoS One. 2025 Jan 17;20(1):e0299440. doi: 10.1371/journal.pone.0299440. eCollection 2025. PLoS One. 2025. PMID: 39823405 Free PMC article.
-
Protein stickiness, rather than number of functional protein-protein interactions, predicts expression noise and plasticity in yeast.BMC Syst Biol. 2012 Sep 27;6:128. doi: 10.1186/1752-0509-6-128. BMC Syst Biol. 2012. PMID: 23017156 Free PMC article.
-
Bcl2-associated athanogene 3 interactome analysis reveals a new role in modulating proteasome activity.Mol Cell Proteomics. 2013 Oct;12(10):2804-19. doi: 10.1074/mcp.M112.025882. Epub 2013 Jul 3. Mol Cell Proteomics. 2013. PMID: 23824909 Free PMC article.
References
-
- Alberts B. (1998) The cell as a collection of protein machines: preparing the next generation of molecular biologists. Cell 92, 291–294 - PubMed
-
- Hakes L., Pinney J. W., Robertson D. L., Lovell S. C. (2008) Protein-protein interaction networks and biology–what's the connection? Nat. Biotechnol. 26, 69–72 - PubMed
-
- Gavin A. C., Bösche M., Krause R., Grandi P., Marzioch M., Bauer A., Schultz J., Rick J. M., Michon A. M., Cruciat C. M., Remor M., Höfert C., Schelder M., Brajenovic M., Ruffner H., Merino A., Klein K., Hudak M., Dickson D., Rudi T., Gnau V., Bauch A., Bastuck S., Huhse B., Leutwein C., Heurtier M. A., Copley R. R., Edelmann A., Querfurth E., Rybin V., Drewes G., Raida M., Bouwmeester T., Bork P., Seraphin B., Kuster B., Neubauer G., Superti-Furga G. (2002) Functional organization of the yeast proteome by systematic analysis of protein complexes. Nature 415, 141–147 - PubMed
-
- Ho Y., Gruhler A., Heilbut A., Bader G. D., Moore L., Adams S. L., Millar A., Taylor P., Bennett K., Boutilier K., Yang L., Wolting C., Donaldson I., Schandorff S., Shewnarane J., Vo M., Taggart J., Goudreault M., Muskat B., Alfarano C., Dewar D., Lin Z., Michalickova K., Willems A. R., Sassi H., Nielsen P. A., Rasmussen K. J., Andersen J. R., Johansen L. E., Hansen L. H., Jespersen H., Podtelejnikov A., Nielsen E., Crawford J., Poulsen V., Sørensen B. D., Matthiesen J., Hendrickson R. C., Gleeson F., Pawson T., Moran M. F., Durocher D., Mann M., Hogue C. W., Figeys D., Tyers M. (2002) Systematic identification of protein complexes in Saccharomyces cerevisiae by mass spectrometry. Nature 415, 180–183 - PubMed
Publication types
MeSH terms
Substances
LinkOut - more resources
Full Text Sources
Molecular Biology Databases
