. 2011 Aug;7(8):e1002236.
doi: 10.1371/journal.pgen.1002236. Epub 2011 Aug 18.

A comprehensive map of mobile element insertion polymorphisms in humans

Affiliations

A comprehensive map of mobile element insertion polymorphisms in humans

Chip Stewart et al. PLoS Genet. 2011 Aug.

Abstract

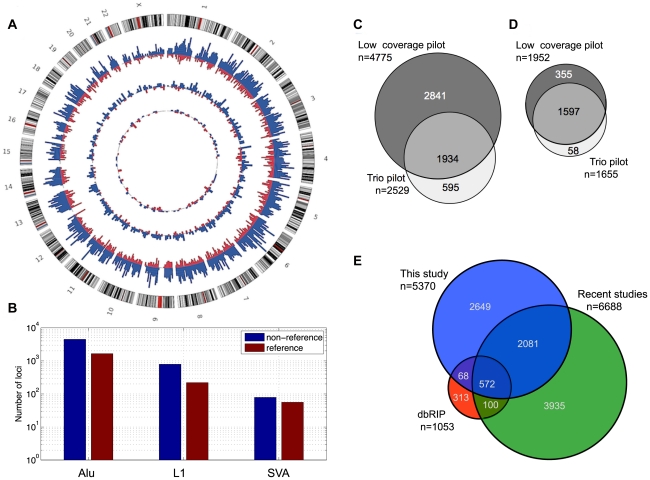
As a consequence of the accumulation of insertion events over evolutionary time, mobile elements now comprise nearly half of the human genome. The Alu, L1, and SVA mobile element families are still duplicating, generating variation between individual genomes. Mobile element insertions (MEI) have been identified as causes for genetic diseases, including hemophilia, neurofibromatosis, and various cancers. Here we present a comprehensive map of 7,380 MEI polymorphisms from the 1000 Genomes Project whole-genome sequencing data of 185 samples in three major populations detected with two detection methods. This catalog enables us to systematically study mutation rates, population segregation, genomic distribution, and functional properties of MEI polymorphisms and to compare MEI to SNP variation from the same individuals. Population allele frequencies of MEI and SNPs are described, broadly, by the same neutral ancestral processes despite vastly different mutation mechanisms and rates, except in coding regions where MEI are virtually absent, presumably due to strong negative selection. A direct comparison of MEI and SNP diversity levels suggests a differential mobile element insertion rate among populations.


Conflict of interest statement

The authors have declared that no competing interests exist.

Figures

Figure 1
Figure 1. MEI detection modes.
a) RP signature for of non-reference MEI detection. The RP signature consists of Illumina read pairs spanning into the element from each side of the insertion. The RP event display shows a heterozygous Alu insertion allele on chromosome 22 from the trio pilot dataset. Fragment mapping quality is shown on the vertical scale. Horizontal grey lines show read pairs uniquely mapped at both ends with a mapped fragment length consistent with the sequence library; the blue and red lines are read pairs spanning into an Alu sequence from the 5′ and 3′ ends. The green vertical line is the position of the insertion. Thick black lines near the top show annotated Alu positions. Red and blue reads bracketing annotated elements are characteristic of mapping artifacts that we removed from insertion detection by masking out regions within a fragment length of an annotated element of the same family as the insertion. b) Signature for SR-based insertion detection. Split-mapped 454 reads span into the element sequence. The SR event display shows split reads spanning into an Alu insertion from the 5′ (blue) or the 3′(red) sides. The vertical green line marks the insertion site. Fully mapped 454 reads are shown in gray. Gray reads that span the breakpoint correspond to the reference allele. Note that the mapping quality increases with the length of the split-mapped segment. The red and blue segments overlap by roughly 15 bp in the target site duplication region that brackets the MEI insertion. c) Overlap between non-reference MEI detected by RP and by SR. d) Overlap between detection methods for reference MEI. Of the 23 1000GP deletion call sets, 11 were RP and 4 were SR. Also shown are the relative proportions of events detected by assembly (yellow) and by read depth (gray) both of which had nearly 100% overlap with RP and SR calls. e) RP signature for reference MEI detection. Read pairs with abnormally long mapped fragment lengths (in green) span over an AluYb8 annotation. The event display shows RP evidence for a homozygous reference MEI in chromosome 22 from the trio dataset. The yellow line at the top marks homologous regions from the chimpanzee assembly, with a gap at the precise location of the variant MEI.
Figure 2
Figure 2. MEI catalog.
a) MEI genomic distribution. Circos plot with non-reference MEI represented in blue and reference MEI in red. The outermost ring of chromosomes show the cytoband structure. The outer histogram displays counts of Alu polymorphisms in bins of 5 Mbp, the middle ring L1 polymorphisms in bins of 10 Mbp, and the innermost ring SVA polymorphisms in bins of 20 Mbp. The radial scale of the site counts is the same for each element type. b) MEI family breakdown. Non-reference MEI (blue) and reference MEI (red). c) Venn diagram of non-reference MEI from each pilot dataset. Most of the loci were detected from the low coverage dataset (dark grey). d) Venn diagram of reference MEI from each pilot dataset. e) Venn diagram of non-reference MEI from this study and other studies –, , .
Figure 3
Figure 3. Non-reference MEI validation and detection sensitivity.
a) Example of PCR gel chromatograph validation results. At this site, three of the 25 low coverage samples show two bands characteristic of heterozygous insertions. Two additional test samples (Pop80 and HeLa) also show the insertion allele. b) False detection rate estimates based on PCR experiments at random sites, broken down by element type (Alu, L1, SVA), algorithm (RP & SR), and dataset (LCP: low coverage pilot, TP: trio pilot). The false detection rate for Alu elements is uniformly <3% while the false detection rates for L1s and SVA element insertions approach 30%, with large error bars (95% confidence intervals) arising from relatively low statistics. c) Non-reference MEI detection overlap from trio samples NA12878 and NA19240. This level of overlap between two independent methods using independent sequence data corresponds to a detection sensitivity of roughly 70% for each algorithm and a combined detection sensitivity of 90% in these samples. d) Non-reference MEI detection sensitivity as a function of allele frequency in the low coverage dataset. PCR results for loci randomly selected from one method were used as a gold standard for the complementary method, and vice versa. PCR also provides an estimate of the allele frequency based on the 25 low coverage samples used for validation experiments. RP (blue) and SR (red) and the combined (black) detection sensitivities rise with frequency. One standard deviation confidence intervals are shown as shaded bars for the RP and SR algorithm, with black error bars for the combined RP+SR detection efficiency.
Figure 4
Figure 4. MEI Alu sub-family breakdown, Target site duplication length.
a) Length of target site duplications bracketing the MEI sites. Different detection modes (top) and different element families (lower plot) exhibit similar distributions target site duplications lengths. b) Alu sub-family breakdown of 1,105 assembled Alu non-reference insertions. Also shown are the Alu breakdowns from reference MEI (ref) from this study, as well as variant Alus found in the HuRef genome by Xing et al. AluYa5 is the most frequent polymorphic Alu sub-family.
Figure 5
Figure 5. MEI allele count spectrum.
a–c) Uncorrected allele count spectra. Non-reference MEI (blue) and reference MEI (red): a) CEU, b) YRI, c) CHBJPT. Loci with 25 or more genotyped samples were included. A random subset of 25 samples was selected for any locus with more than 25 genotyped samples. Gray dashed lines are based on neutral model fits from the full MEI spectra, modified to account for the respective ascertainment conditions, (θ/2N) for reference MEI, (θ/i)(2N−i)/(2N) for non-reference MEI, where N = 25 is the number of samples in the spectrum. d–f) MEI allele count spectra. d) CEU, e) YRI, f) CHBJPT. The spectra are corrected for each detection mode sensitivity and genotyping efficiency according to the expression in the legend. Gray dashed line is a fit to θ/i, where i is the allele count and θ is the diversity parameter. Only counts in the range of 7≤i≤47 were used in the fit (bins with vertical one sigma error bars).
Figure 6
Figure 6. MEI allele frequency spectra, PCA, counts of variants between trio samples.
a) Element family breakdown of the combined population allele frequency spectra. L1 and SVA are scaled up to allow comparison with the Alu spectrum. b) MEI and SNP allele frequency spectra across three population groups. The corresponding allele frequency spectra of SNPs relative to the ancestral genome from the 1000 Genomes low coverage pilot project are superimposed as dotted lines. The SNP spectra are scaled down by a factor of 500 for this comparison. c) Principal component analysis of MEI genotypes. CEU: blue; YRI: red; CHB: cyan; JPT: green. The first and second principal components are plotted. d) Total number of MEI between trio samples versus coalescent time based on SNP differences between the sample pairs.
Figure 7
Figure 7. MEI and SNP heterozygosity in low coverage samples.
a) MEI vs. SNP heterozygosity scatterplot (πMEI vs. πSNP): The dashed line is a linear model constrained to pass through the centroid of the YRI (red) samples and the origin. The gray region represents an extrapolation from human-chimpanzee (H-C) MEI and SNP differences between the respective genome assemblies. b) Averaged population μMEI vs. coalescent time scaled to thousands of years, assuming that SNP mutation rate is a steady clock (μSNP∼1.8×10⁻⁸ mutations per site per generation). c) MEI mutation rates based on heterozygosity (solid circles) and based on allele frequency fits (vertical error bars) for population groups (CEU: blue, YRI: red, CHBJPT: green, all three: black) and estimated separately for element families (all families combined: MEI, Alu, L1, and SVA). Error bars are statistical only.

Similar articles

Cited by

References

    1. Cordaux R, Batzer MA. The impact of retrotransposons on human genome evolution. Nat Rev Genet. 2009;10:691–703. - PMC - PubMed
    1. Cordaux R, Hedges DJ, Batzer MA. Retrotransposition of Alu elements: how many sources? Trends Genet. 2004;20:464–467. - PubMed
    1. Deininger PL, Batzer MA, Hutchison CA, 3rd, Edgell MH. Master genes in mammalian repetitive DNA amplification. Trends Genet. 1992;8:307–311. - PubMed
    1. Mills RE, Bennett EA, Iskow RC, Devine SE. Which transposable elements are active in the human genome? Trends Genet. 2007;23:183–191. - PubMed
    1. Rhead B, Karolchik D, Kuhn RM, Hinrichs AS, Zweig AS, et al. The UCSC Genome Browser database: update 2010. Nucleic Acids Res. 2010;38:D613–619. - PMC - PubMed

Publication types

Substances