. 2011;6(8):e22895.
doi: 10.1371/journal.pone.0022895. Epub 2011 Aug 18.

Protein-binding microarray analysis of tumor suppressor AP2α target gene specificity

Affiliations

Protein-binding microarray analysis of tumor suppressor AP2α target gene specificity

Jan Kerschgens et al. PLoS One. 2011.

Abstract

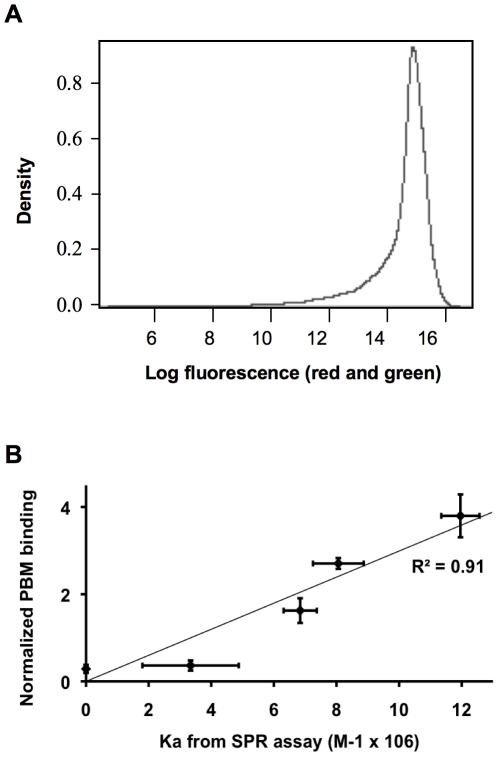
Cheap and massively parallel methods to assess the DNA-binding specificity of transcription factors are actively sought, given their prominent regulatory role in cellular processes and diseases. Here we evaluated the use of protein-binding microarrays (PBM) to probe the association of the tumor suppressor AP2α with 6000 human genomic DNA regulatory sequences. We show that the PBM provides accurate relative binding affinities when compared to quantitative surface plasmon resonance assays. A PBM-based study of human healthy and breast tumor tissue extracts allowed the identification of previously unknown AP2α target genes and it revealed genes whose direct or indirect interactions with AP2α are affected in the diseased tissues. AP2α binding and regulation was confirmed experimentally in human carcinoma cells for novel target genes involved in tumor progression and resistance to chemotherapeutics, providing a molecular interpretation of AP2α role in cancer chemoresistance. Overall, we conclude that this approach provides quantitative and accurate assays of the specificity and activity of tumor suppressor and oncogenic proteins in clinical samples, interfacing genomic and proteomic assays.


Conflict of interest statement

Competing Interests: The authors have declared that no competing interests exist.

Figures

Figure 1
Figure 1. Analysis of AP2α binding to PBM DNA sequences.
(A) Distribution of the measured values on each slide (red and green channel) after normalization. Values on the X axis represent the log2 of green or red fluorescences. Following value normalization, tracings obtained from the two channels are superimposed. (B) Association of protein-binding microarrays (PBM) and SPR-estimated binding affinities. Five different sequences of 252 bp length were analyzed for AP2α binding using PBM and SPR. The resulting relative affinity measurement averages of 3 independent assays each were fitted by a linear regression.
Figure 2
Figure 2. Venn diagrams depicting the overlap between the sequences most potently bound by AP2α from different sources.
(A) The 282 sequences found to be significantly bound by recombinant AP2α on hu6k PBM were compared to 1017 sequences bound by AP2α from healthy breast tissues and 1925 sequences from breast cancer tissues. (B) The 282 sequences significantly bound by recombinant AP2α were compared to 48 sequences bound by AP2α from the TRANSFAC database and to the 149 sequences differentially bound by AP2α when comparing healthy to cancer breast tissues. The comparison is as in panel A, except that the datasets obtained from tissue extracts were obtained using a significance cut-off of p<0.01.
Figure 3
Figure 3. Functional analysis of AP2α target genes.
Most prominent functional categories of diseases and pathological disorders (A), or of biological functions (B), associated with 272 potential AP2αtarget genes (PBM binding values, p<0.05). The threshold significance line indicates a value of −log(p-value) greater than 1.25.
Figure 4
Figure 4. Network diagrams illustrating prominent regulatory relationships among AP2α-bound genes.
Grey-filled shapes represent genes significantly bound by recombinant AP2α on the PBM. Main functions related as these networks, as constructed and classified by the Ingenuity Analysis Software are cellular development, cell-to-cell signaling and interaction, and embryonic development (A), cell death, cancer and genetic disorder (B), or cancer, cell cycle and embryonic development (C).
Figure 5
Figure 5. Functional validation of AP2α binding sites selected from PBM and weight matrix-based predictions.
A) Genomic sequences corresponding to the OCM and GAS2 genes were selected on the basis of low and high binding potential, respectively, from the PBM dataset, while the KLK5 sequence was selected as an AP2α-bound promoter by weight matrix-based predictions with a score of 39 (medium affinity). SW480 cells were transiently co-transfected with reporter constructs containing these ∼900 bp regulatory sequences genomic sequences inserted upstream of a minimal promoter and eGFP sequence, and with either an AP2α expression vector or with the corresponding empty control vector. eGFP fluorescence was quantified by cytofluorometry. Graphs show the fold change of eGFP expression in absence or presence of AP2α as normalized to the fluorescence level obtained from the cotransfection of the eGFP reporter plasmids alone (n = 4, ***: p<0.001, **: p<0.005; two-tailed, two-sample equal variance t-test). B) ChIP-qPCR analysis of in vivo AP2α binding was performed using KM12C colon cancer cells that constitutively expresses AP2α . The ∼900 bp sequences used in the eGFP reporter assay of panel A where searched for AP2α binding motifs utilizing the prediction weight matrix shown in Fig. S2, and qPCR primers were designed for the quantification of the assigned regions. A known AP2α binding site on the Estrogen Receptor 1 gene (ESR1) promoter serves as positive control, while an intergenic sequence upstream of the KLK5 gene was used as negative control. The abundance of RNA polymerase II indicates promoter occupancy by the transcriptional machinery. The initial concentration ratio of IP sample to sample Input were calculated as previously described . Values obtained from the immunoprecipitated samples were multiplied by a factor of 100 before plotting.
Figure 6
Figure 6. PBM analysis of AP2α extracted from healthy or tumor tissue samples.
(A) Result of a comparison between 4 normal samples and 4 cancer samples, in the form of an MA-plot. The X-axis (A values) shows the average of the log ratios (protein/DNA) of binding from normal and cancer extracts to each target DNA sequence, and it thus displays the average AP2 binding value to each gene. The Y-axis (M values) represents the averaged difference of log ratios (protein/DNA) between the normal and the cancer samples, and thus represent differential binding when comparing healthy and diseased tissues. Potential differential binding was defined as an absolute value of M>1, as shown with dashed lines, corresponding to a 2-fold difference between cancer and normal tissues. 149 genes were selected using this cut-off. Circles indicate statistically significant differential binding. (B) Same data for a comparison between two sets of 4 randomly selected cancer samples; 52 genes were selected using the same criteria as for panel (A).

References

    1. Lander ES, Linton LM, Birren B, Nusbaum C, Zody MC, et al. Initial sequencing and analysis of the human genome. Nature. 2001;409:860–921. - PubMed
    1. Venter JC, Adams MD, Myers EW, Li PW, Mural RJ, et al. The sequence of the human genome. Science. 2001;291:1304–1351. - PubMed
    1. Kent WJ, Sugnet CW, Furey TS, Roskin KM, Pringle TH, et al. The human genome browser at UCSC. Genome Res. 2002;12:996–1006. - PMC - PubMed
    1. Karolchik D, Kuhn RM, Baertsch R, Barber GP, Clawson H, et al. The UCSC Genome Browser Database: 2008 update. Nucleic Acids Res. 2008;36:D773–779. - PMC - PubMed
    1. Thomas DJ, Rosenbloom KR, Clawson H, Hinrichs AS, Trumbower H, et al. The ENCODE Project at UC Santa Cruz. Nucleic Acids Res. 2007;35:D663–667. - PMC - PubMed

Publication types

Substances