. 2011;6(8):e23434.
doi: 10.1371/journal.pone.0023434. Epub 2011 Aug 18.

Killing hypoxic cell populations in a 3D tumor model with EtNBS-PDT

Affiliations

Killing hypoxic cell populations in a 3D tumor model with EtNBS-PDT

Conor L Evans et al. PLoS One. 2011.

Abstract

An outstanding problem in cancer therapy is the battle against treatment-resistant disease. This is especially true for ovarian cancer, where the majority of patients eventually succumb to treatment-resistant metastatic carcinomatosis. Limited perfusion and diffusion, acidosis, and hypoxia play major roles in the development of resistance to the majority of front-line therapeutic regimens. To overcome these limitations and eliminate otherwise spared cancer cells, we utilized the cationic photosensitizer EtNBS to treat hypoxic regions deep inside in vitro 3D models of metastatic ovarian cancer. Unlike standard regimens that fail to penetrate beyond ∼150 µm, EtNBS was found to not only penetrate throughout the entirety of large (>200 µm) avascular nodules, but also concentrate into the nodules' acidic and hypoxic cores. Photodynamic therapy with EtNBS was observed to be highly effective against these hypoxic regions even at low therapeutic doses, and was capable of destroying both normoxic and hypoxic regions at higher treatment levels. Imaging studies utilizing multiphoton and confocal microscopies, as well as time-lapse optical coherence tomography (TL-OCT), revealed an inside-out pattern of cell death, with apoptosis being the primary mechanism of cell killing. Critically, EtNBS-based photodynamic therapy was found to be effective against the model tumor nodules even under severe hypoxia. The inherent ability of EtNBS photodynamic therapy to impart cytotoxicity across a wide range of tumoral oxygenation levels indicates its potential to eliminate treatment-resistant cell populations.


Conflict of interest statement

Competing Interests: The authors have declared that no competing interests exist.

Figures

Figure 1
Figure 1. Uptake of the photosensitizer BPD over 1.5 and 4.5 hours.
Images (A) and (B) are from a sample incubated with BPD for 1.5 hours; images (C) and (D) are from a 4.5 hour incubation. (A) Transmission image of two OvCa nodules following cryosection. The thickness of the slice was 30 µm. Matrigel can be seen attached to the nodules in the bottom-left portion of the image. (B) Confocal image of BPD fluorescence in the nodule, revealing its limited uptake into the nodules. (C) DIC image of a similarly prepared 30 µm slice through an OvCa nodule. (D) BPD fluorescence image, showing that even after 4.5 hours, the majority of BPD is retained in the periphery of large nodules.
Figure 2
Figure 2. Physiological factors can cause poor therapeutic outcomes in metastatic OvCa nodules.
Large nodules stained for the presence of ECM show coatings of human fibronectin (A), collagen IV (B), and laminin V (C), in red. Cell nuclei were stained with DAPI (blue). Staining with the Golgi protein GM130 (C, green) reveals that the outer nodule cell layer is polarized. Multiphoton microscopy of PIM-stained, day 13 nodules reveals the presence of hypoxic core cells (D, false color). pH imaging using SNARF-4F shows that the core of the model nodules are acidic (E). Autofluorescence gave rise to the two deeply acidic (pH<5.5) point artifacts in the center of the image.
Figure 3
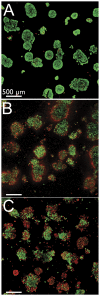
Figure 3. The cores of large OvCa nodules survive carboplatin treatment and BPD-PDT.
(A) Live/Dead images of nodules without treatment, (B) after 72 hours of carboplatin treatment at 1 µM, and (C) following BPD-PDT at 240 nM at 10 J/cm2. Treated cultures both show a consistent pattern of nodular core survival. Viable cells are green, while dead cells stain red.
Figure 4
Figure 4. EtNBS concentrates into the cores of 3D OvCa nodules.
(A–E) Time-lapse confocal microscopy images of day 13 nodules incubated with EtNBS at 500 nM. EtNBS is observed to penetrate into nodules rapidly under three hours. (F) Confocal image of a frozen, cyrosectioned nodule slice showing the actual concentration of EtNBS into the nodule core. The presence of EtNBS was confirmed using hyperspectral microscopy.
Figure 5
Figure 5. Treatment response of OvCa nodules to EtNBS-PDT.
(A) Bar plot of day 13 nodule viability following EtNBS-PDT across a range of light doses. (B) Live/Dead imaging of day 13 nodules treated with 5 J/cm2 of 652 nm light, showing nodule core cytotoxicity. (C) Day 13 nodules treated at 20 J/cm2. (D) Scatter plots of nodule live∶dead ratio vs. volume of thousands of individual BPD and EtNBS PDT treated nodules. The axes are plotted on a logarithmic scale. The black dotted lines are power-law fits to the data points provided as an aid to the eye. NT = no treatment control; LO = light only control; EO = EtNBS only, without light control.
Figure 6
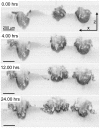
Figure 6. TL-OCT visualizes the treatment dynamics of large OvCa model nodules following EtNBS-PDT.
Each image is one cross-sectional XZ image from the time-lapse movie (Video S2). The nodules are observed to degrade following PDT via the appearance of numerous highly scattering apoptotic bodies.
Figure 7
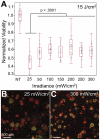
Figure 7. Irradiance dependence of EtNBS-PDT on therapeutic outcome.
(A) Bar plot of nodule viability following 15 J/cm2 PDT across a range of irradiances. (B) Live/Dead image of a culture treated at 25 mW/cm2 irradiance. (C) Live/Dead image of a culture treated at 300 mW/cm2. NT = no treatment control.
Figure 8
Figure 8. Bar plot of EtNBS-PDT treatment response from cultures incubated and treated under 100% N2 atmosphere.
NT = no treatment control; LO = light only control; EO = EtNBS only, without light control. Asterisks indicate the statistical significance of each treatment condition when compared to the EtNBS only, no light control using a Student's t-test: * p<.005, ** p<.007, *** p<.02, and **** p<.0001.

References

    1. Berek JS, Bast RCJ. Kufe DW, Pollack RE, Weichselbaum RR, Bast RCJ, Gansler TS, et al., editors. Ovarian Cancer.
    1. Tannock IF, Lee CM, Tunggal JK, Cowan DSM, Egorin MJ. Limited penetration of anticancer drugs through tumor tissue: a potential cause of resistance of solid tumors to chemotherapy. Clin Cancer Res. 2002;8:878–884. - PubMed
    1. Jain RK. Delivery of molecular and cellular medicine to solid tumors. J Control Release. 1998;53:49–67. - PubMed
    1. Fukumura D, Jain R. Tumor microvasculature and microenvironment: targets for anti-angiogenesis and normalization. Microvascular Research. 2007;74:72–84. - PMC - PubMed
    1. Teicher BA. Hypoxia and drug resistance. Cancer Metastasis Rev. 1994;13:139–168. - PubMed

Publication types

MeSH terms