

Compression of morbidity 1980-2011: a focused review of paradigms and progress
- PMID: 21876805
- PMCID: PMC3163136
- DOI: 10.4061/2011/261702
Compression of morbidity 1980-2011: a focused review of paradigms and progress
Abstract
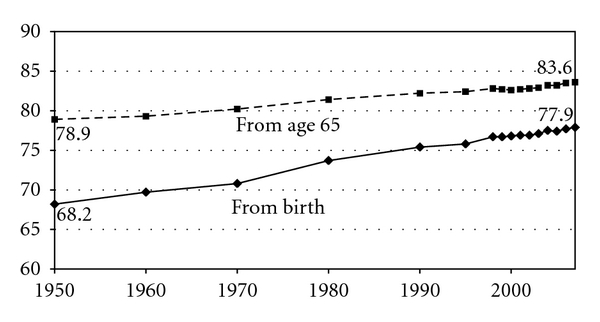
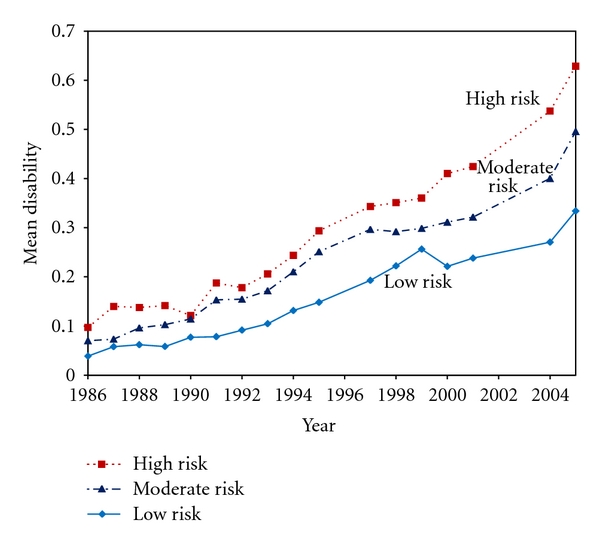
The Compression of Morbidity hypothesis-positing that the age of onset of chronic illness may be postponed more than the age at death and squeezing most of the morbidity in life into a shorter period with less lifetime disability-was introduced by our group in 1980. This paper is focused upon the evolution of the concept, the controversies and responses, the supportive multidisciplinary science, and the evolving lines of evidence that establish proof of concept. We summarize data from 20-year prospective longitudinal studies of lifestyle progression of disability, national population studies of trends in disability, and randomized controlled trials of risk factor reduction with life-style-based "healthy aging" interventions. From the perspective of this influential and broadly cited paradigm, we review its current history, the development of a theoretical structure for healthy aging, and the challenges to develop coherent health policies directed at reduction in morbidity.
Figures


Similar articles
-
Frailty, heart disease, and stroke: the Compression of Morbidity paradigm.Am J Prev Med. 2005 Dec;29(5 Suppl 1):164-8. doi: 10.1016/j.amepre.2005.07.004. Am J Prev Med. 2005. PMID: 16389144
-
Measuring and monitoring success in compressing morbidity.Ann Intern Med. 2003 Sep 2;139(5 Pt 2):455-9. doi: 10.7326/0003-4819-139-5_part_2-200309021-00015. Ann Intern Med. 2003. PMID: 12965976 Review.
-
The theory and practice of active aging.Curr Gerontol Geriatr Res. 2012;2012:420637. doi: 10.1155/2012/420637. Epub 2012 Oct 21. Curr Gerontol Geriatr Res. 2012. PMID: 23118746 Free PMC article.
-
The compression of morbidity: near or far?Milbank Q. 1989;67(2):208-32. Milbank Q. 1989. PMID: 2698444 Review.
-
Lifestyle habits and compression of morbidity.J Gerontol A Biol Sci Med Sci. 2002 Jun;57(6):M347-51. doi: 10.1093/gerona/57.6.m347. J Gerontol A Biol Sci Med Sci. 2002. PMID: 12023263
Cited by
-
Cycling promotion and non-communicable disease prevention: health impact assessment and economic evaluation of cycling to work or school in Florence.PLoS One. 2015 Apr 30;10(4):e0125491. doi: 10.1371/journal.pone.0125491. eCollection 2015. PLoS One. 2015. PMID: 25928421 Free PMC article.
-
The CEPH aging cohort and biobank: a valuable collection of biological samples from exceptionally long-lived French individuals and their offspring for longevity studies.Geroscience. 2024 Apr;46(2):2681-2695. doi: 10.1007/s11357-023-01037-4. Epub 2023 Dec 23. Geroscience. 2024. PMID: 38141157 Free PMC article.
-
Morbidity compression in myocardial infarction 2006 to 2015 in terms of changing rates and age at occurrence: A longitudinal study using claims data from Germany.PLoS One. 2018 Aug 23;13(8):e0202631. doi: 10.1371/journal.pone.0202631. eCollection 2018. PLoS One. 2018. PMID: 30138437 Free PMC article.
-
US trends in quality-adjusted life expectancy from 1987 to 2008: combining national surveys to more broadly track the health of the nation.Am J Public Health. 2013 Nov;103(11):e78-87. doi: 10.2105/AJPH.2013.301250. Epub 2013 Sep 12. Am J Public Health. 2013. PMID: 24028235 Free PMC article.
-
The Healthy Core Metabolism: A New Paradigm for Primary Preventive Nutrition.J Nutr Health Aging. 2016 Mar;20(3):239-47. doi: 10.1007/s12603-015-0560-6. J Nutr Health Aging. 2016. PMID: 26892572
References
-
- Fries JF. Aging, natural death, and the compression of morbidity. New England Journal of Medicine. 1980;303(3):130–135. - PubMed
-
- Gruenberg EM. The failures of success. Milbank Memorial Fund Quarterly, Health and Society. 1977;55(1):3–24. - PubMed
-
- Fries JF. Measuring and monitoring success in compressing morbidity. Annals of Internal Medicine. 2003;139(5):455–459. - PubMed
-
- Fries JF. The compression of morbidity: near or far? Milbank Quarterly. 1989;67(2):208–232. - PubMed
-
- Fries JF. Reducing disability in older age. Journal of the American Medical Association. 2002;288(24):3164–3166. - PubMed
LinkOut - more resources
Full Text Sources
