. 2011 Oct 28;286(43):37813-29.
doi: 10.1074/jbc.M110.200675. Epub 2011 Aug 30.

Drug-induced senescence generates chemoresistant stemlike cells with low reactive oxygen species

Affiliations

Drug-induced senescence generates chemoresistant stemlike cells with low reactive oxygen species

Santhi Achuthan et al. J Biol Chem. .

Abstract

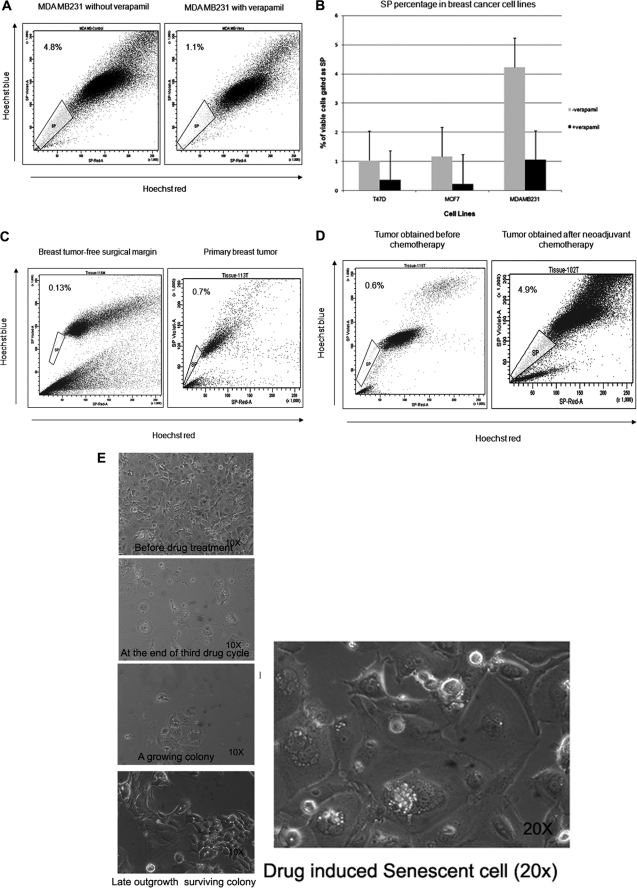
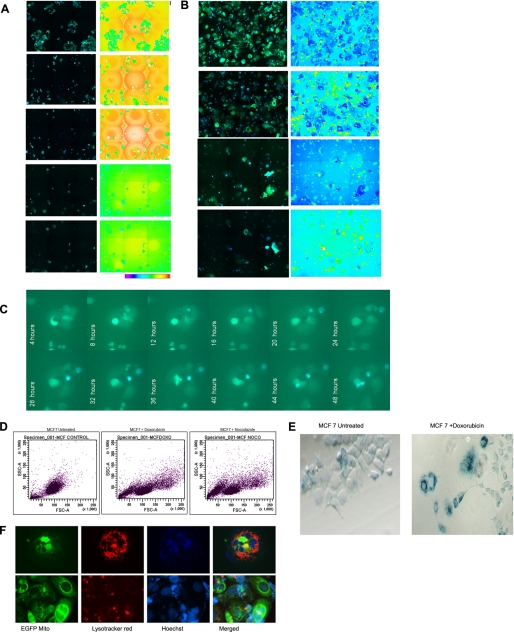
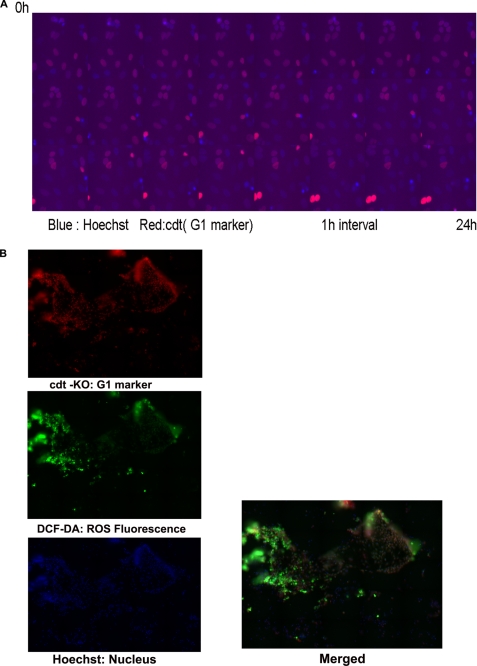
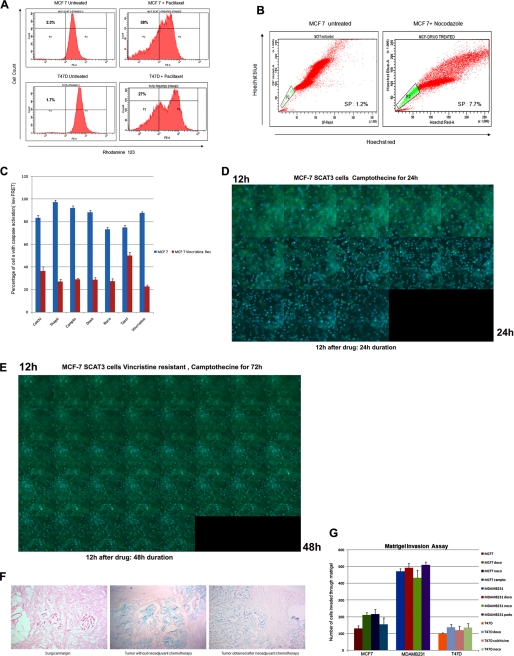
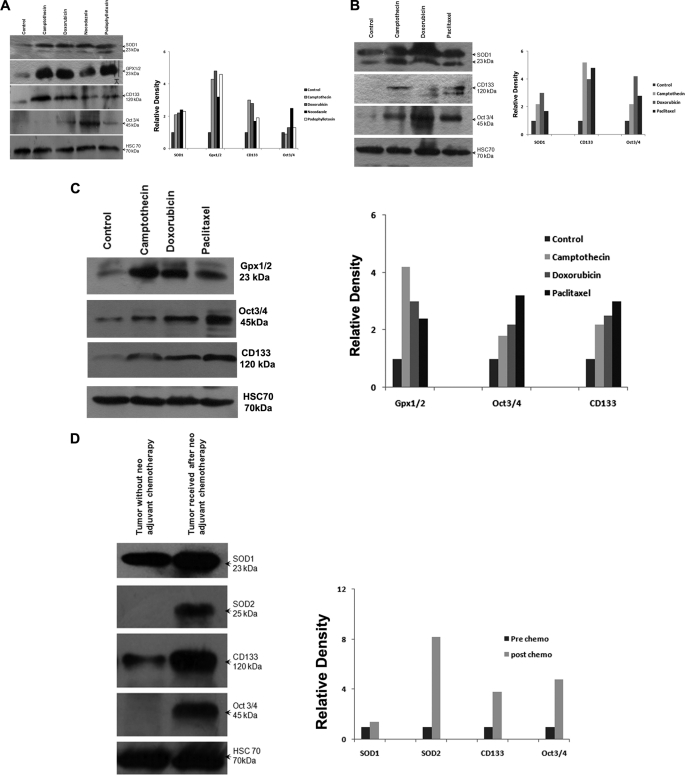
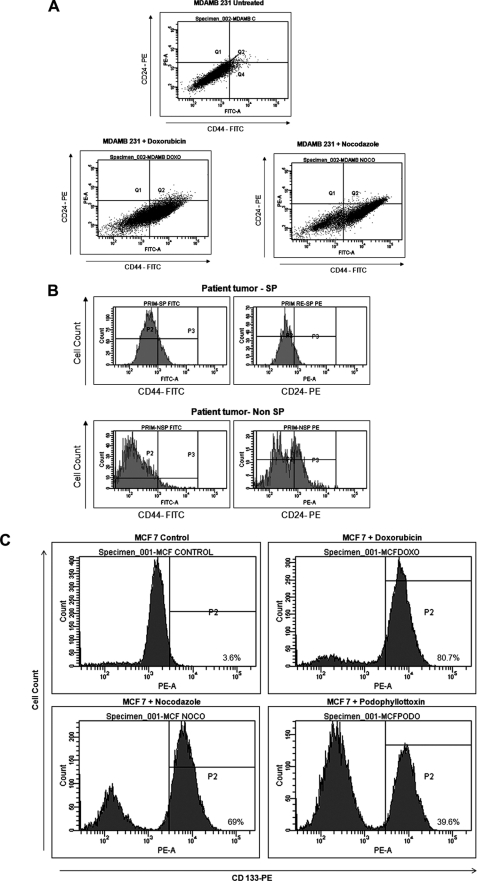
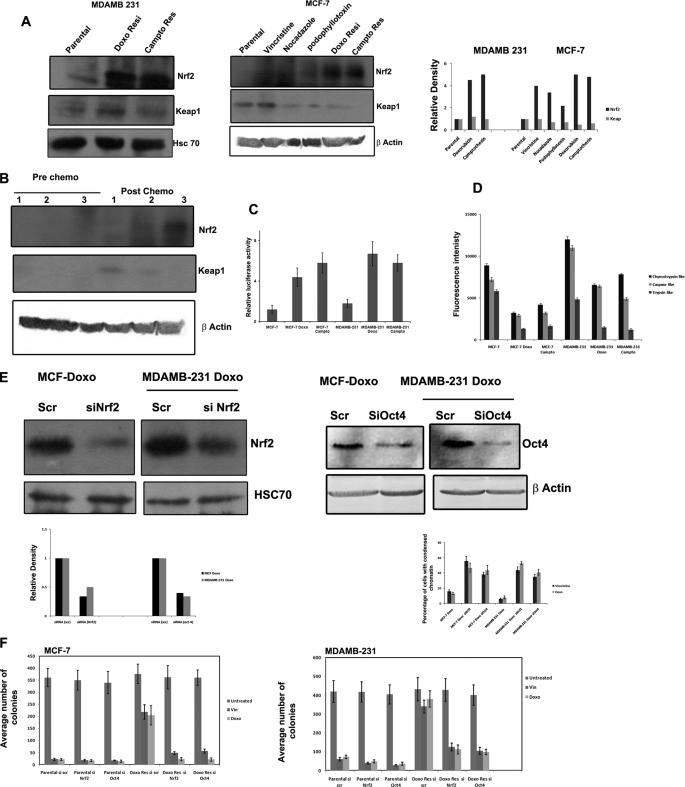
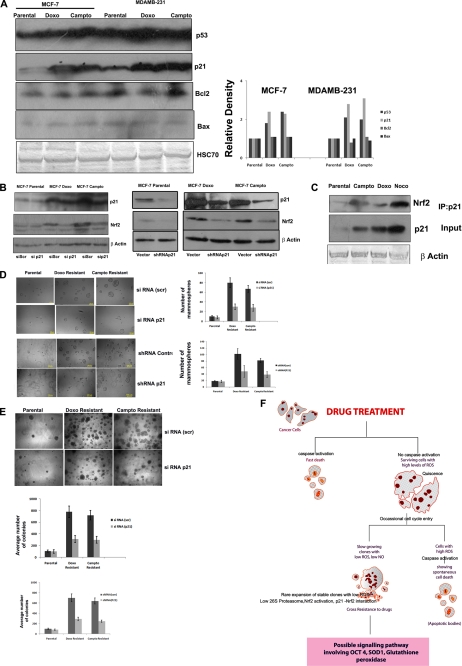
Tumor recurrence after chemotherapy or radiation remains a major obstacle to successful cancer treatment. A subset of cancer cells, termed cancer stem cells, can elude conventional treatments and eventually regenerate a tumor that is more aggressive. Despite the large number of studies, molecular events that govern the emergence of aggressive therapy-resistant cells with stem cell properties after chemotherapy are poorly defined. The present study provides evidence for the rare escape of tumor cells from drug-induced cell death, after an intermediate stay in a non-cycling senescent stage followed by unstable multiplication characterized by spontaneous cell death. However, some cells appear to escape and generate stable colonies with an aggressive tumor stem cell-like phenotype. These cells displayed higher CD133 and Oct-4 expression. Notably, the drug-selected cells that contained low levels of reactive oxygen species (ROS) also showed an increase in antioxidant enzymes. Consistent with this in vitro experimental data, we observed lower levels of ROS in breast tumors obtained after neoadjuvant chemotherapy compared with samples that did not receive preoperative chemotherapy. These latter tissues also expressed enhanced levels of ROS defenses with enhanced expression of superoxide dismutase. Higher levels of Oct-4 and CD133 were also observed in tumors obtained after neoadjuvant chemotherapy. Further studies provided evidence for the stabilization of Nrf2 due to reduced 26 S proteasome activity and increased p21 association as the driving signaling event that contributes to the transition from a high ROS quiescent state to a low ROS proliferating stage in drug-induced tumor stem cell enrichment.


Figures

FIGURE 1.
FIGURE 1.
SP cells were present in breast cancer cell lines and breast tumor samples. A, MDA MB231 cells were stained with Hoechst 33342 dye in the presence (right) or absence (left) of 50 μmol/liter verapamil and analyzed by flow cytometry. B, percentage of SP cells gated with or without the addition of verapamil in listed cancer cell lines from three representative experiments. C, a representative scatter plot of SP analysis from tumor-free surgical margin (left) and primary tumor (right). D, SP analysis from a tumor obtained after neoadjuvant chemotherapy (right) and a tumor that had not received preoperative chemotherapy (left). Significantly higher proportions of SP cells were present in tumors after chemotherapy. E, different stages of clonal expansion of doxorubicin-treated MCF-7 cells observed by phase-contrast microscopy. A ×20 magnified image of senescent culture is also shown in the left panel. Error bars, S.D.
FIGURE 2.
FIGURE 2.
Drug-induced senescence and emergence of multidrug-resistant cells. A, MCF-7 cells stably expressing FRET probe SCAT3 consisting of fusion of ECFP-DEVD-EYFP developed as described. The cells were exposed to doxorubicin. ECFP/EYFP FRET ratio imaging was carried out using a 96-well plate, Bio-Imager, pathway 435 at 6 × 6 montage at the indicated days after drug treatment. The merged image of the ECFP channels and the EYFP FRET channel is shown. Loss of FRET upon caspase activation enhances ECFP signal, leading to an increase in blue color in the real merged image. Ratio image and ratio scale are also given. B, the above cell lines were treated with nocodazole and imaged as described earlier. C, MCF-7 SCAT3 stable cells were treated with vincristine for three cycles as described. The remaining senescent cells were trypsinized and seeded on a chambered coverglass. FRET live cell imaging was done using a BD-CARV Bio-Imager for 48 h as described. The merged ECFP and EYFP FRET channel at the indicated time point is shown. Occasional cell division and spontaneous cell death by caspase activation are evident in the image. D, flow cytometry analysis of the side scatter (y) and forward scatter (x) factors (i.e. granularity and size, respectively) of MCF-7 cells after a 30-day treatment with paclitaxel. Highly heterogeneous populations with three different scatter factor values emerged after drug exposure. E, expression of SA-β-gal in MCF-7 cells following prolonged exposure to doxorubicin. The enlarged, flat cells showed strong cytoplasmic positivity, whereas the newly emerged cells were negative for SA-β-gal. F, MCF-7 cells expressing Mito-EYFP were treated with vincristine for three cycles. The cells were stained with LysoTracker Red and nuclear dye Hoechst and imaged under a fluorescent microscope to visualize mitochondria (green), lysosomes (red), and nuclei (blue). Two representative images of cells showing senescent cells with high lysosomal and mitochondrial density are shown. In the lower panel, few cells of small size with less lysosomal mass are evident.
FIGURE 3.
FIGURE 3.
Analysis of ROS in breast cancer cell lines and cell cycle status. A, MDAMB 231 cells were transfected with Cdt1-KO, a live cell marker for the G1 cell cycle phase. The stably expressing cells were generated as described. The stable integration of Cdt1 was validated by live cell imaging after Hoechst staining. Imaging was carried out for 24 h at an interval of 30 min. Cells in the G1 phase show red color in the nucleus with gradual disappearance of nuclear red upon entry into S phase and complete loss at G2 phase. Non-red blue nuclei in the merged image represent G2 phase cells. A representative merged image is shown. B, MDAMB 231 stably expressing Cdt1-KO cells grown on 96 imaging plates were treated with nocodazole as described. A representative well containing both senescent and growing clone was stained with dichlorodihydrofluorescein diacetate as described, counterstained with Hoechst. Imaging was carried out by a 96-well plate Bio-Imager with 5 × 5 montages to cover a large area of view. Multiple clones with varying level of ROS are seen. The red and non-red nuclei indicate the cycling status of cells.
FIGURE 4.
FIGURE 4.
Characteristics of drug-selected cells. A, MCF-7 and T47D cells and drug-escaped clones from a paclitaxel-treated population were stained for the rhodamine 123 dye efflux assay as described. Drug efflux was analyzed by FACS. Drug-selected cells generated a significant rhodamine 123low fraction when compared with the parental cell line. B, MCF-7 and MCF-7 drug-escaped cells after treatment with nocodazole were analyzed for side population. An increase in side population cells is evident in the surviving clones. C, MCF-7 SCAT3 cells and MCF-7 SCAT3 vincristine-resistant clones were exposed to different drugs and imaged by FRET microscopy. The percentage of cells with loss of FRET is calculated for each drug, and the histogram is shown. D, MCF-7 SCAT3 cells and MCF-7 SCAT3 vincristine-resistant clones were exposed to camptothecin. After 12 h of drug treatment, the cells were placed in a live cell incubation chamber, and FRET imaging was carried out for an additional 12 h for MCF-SCAT3 cells and 48 h for vincristine-resistant cells at an interval of 10 min. Representative time lapse images of MCF7 SCAT3 cells (D) and vincristine-resistant cells (E) are shown. By 24 h of drug treatment, most parent cells showed an increase in ECFP fluorescence, indicating caspase activation (blue cells); the percentage of FRET lost cells is significantly less in drug-resistant clone even at 48 h of camptothecin treatment. F, breast tissue from surgical margin and from tumor with and without adjuvant chemotherapy was stained for SA-β-gal as described. Representative images are given. Strong positive staining for SA-β-gal is evident in the tumor samples. G, the respective parental cells and respective drug-surviving cells were evaluated for an in vitro Matrigel invasion assay as described. Each experiment was performed in triplicate, and the number of cells invaded across the membrane is presented. Error bars, S.D.
FIGURE 5.
FIGURE 5.
Analysis of Oct-4 and antioxidant enzymes in drug-selected cells and primary tumors. A, Western blot analysis of total SOD1, glutathione peroxidase, CD133, and Oct-4 levels from whole cell lysates of MCF-7 control and MCF-7 drug-selected cells (50 μg of protein/lane). Hsc70 served as loading control. Densitometry measurements of bands were quantitated using ImageJ software and shown as a graph. B, Western blot analysis of total SOD1, CD133, and Oct-4 levels from whole cell lysates of MDA MB231 control and MDA MB231 drug-selected cells (50 μg of protein/lane). Hsc70 was used as loading control. Densitometry measurements of bands were quantitated using ImageJ software and shown as a graph. C, Western blot analysis of total glutathione peroxidase, Oct-4, and CD133 levels from whole cell lysates of T47D control and T47D drug-selected cells (50 μg of protein/lane). Hsc70 was used as loading control. Densitometry measurements of bands were quantitated and are shown as relative density. D, Western blots of tissue extracts from primary breast tumors probed for SOD1, SOD2, CD133, and Oct-4 (50 μg of protein/lane). Hsc70 was used as loading control. Relative density of the bands analyzed by ImageJ software is shown as a graph.
FIGURE 6.
FIGURE 6.
Analysis of CSC markers in drug-selected cells and primary tumors. A, MDAMB 231 and drug-selected cells were stained using CD44-FITC and CD24-PE as described. Scatter plot of CD44+/CD24−/low subpopulation in MDAMB 231 drug-selected cells by flow cytometry is indicated. Cells in Q4 correspond to CD44+/CD24−/low cells. B, FACS analysis of candidate surface markers for breast cancer stem cells CD44 and CD24 in the SP and non-SP fractions from a primary breast tumor. The majority of SP cells showed the stem cell phenotype CD44+/CD24−/low. C, MCF-7 parental cells and resistant clones generated after the indicated drug treatment were stained with CD133 PE antibody. Respective FACS histograms are shown.
FIGURE 7.
FIGURE 7.
Nrf2 signaling in drug-escaped cells and possible signaling of CSC induction. A, the whole cell extracts prepared from MDAMB 231, MCF-7, and the indicated drug-resistant cells were separated on SDS-PAGE and blotted using antibodies against Nrf2, Keap1, Hsc70, and β-actin. B, whole cell extract prepared from three prechemotherapy and three postchemotherapy breast cancer patients were probed using antibodies against Nrf2 and Keap1. β-Actin served as loading control. C, MCF-7 and MDAMB 231 and the indicated drug-escaped cells were transfected with NQO1-ARE luciferase reporter plasmid and PRL −TK as control plasmid. 48 h after transfections, luciferase activity was measured as described. D, chymotryptic, tryptic, and caspase-like 26 S proteasome activities were determined using protein extract prepared from the indicated cell lines by spectrofluorimetry as described. Mean fluorescence intensity representing the corresponding enzymatic activity is shown (n = 3). E, doxorubicin-resistant MCF-7 and MDAMB 231 cells were transfected with either scrambled siRNA or siRNA against Oct-4 or Nrf2. The Western blot of Nrf2 and Oct-4 in transfected cells is shown to confirm the silencing. Densitometry measurements of bands were quantitated using ImageJ software and shown as graph. 48 h after transfection, the cells were treated with vincristine or doxorubicin for 24 h. The cell death was quantified after staining the cells with Hoechst dye to calculate the percentage of cells with condensed chromatin (n = 3). F, doxorubicin-resistant MCF-7 and MDAMB 231 cells as well as the respective parental cells were transfected with either scrambled siRNA or siRNA against Oct-4 or Nrf2. The cells were treated with vincristine or doxorubicin as above for 72 h. A long term colony assay was carried out as described. The average number of colonies counted for each group is represented as a graph (n = 3). Error bars, S.D.
FIGURE 8.
FIGURE 8.
p21-mediated stabilization of Nrf2 contributes to tumor stem cell enrichment. A, the whole cell extract prepared from the indicated cells was probed with p53, p21, Bax, and Bcl2 as described. HSC70 served as loading control. Densitometry measurements of bands were quantitated using ImageJ software and shown as a graph. B, parental MCF-7 cells and doxorubicin-resistant and camptothecin-resistant clones were transfected with RNAi p21 and blotted for p21 and Nrf2. The left panel represents the indicated cells stably transfected with shRNA against p21 or with control vector, probed with p21, Nrf2, and β-actin antibodies. C, p21 was immunoprecipitated from parental MCF-7 cells and doxorubicin-resistant and camptothecin-resistant clones. Probed with Nrf2 antibody. The whole cell extract used for immunoprecipitation (IP) is probed with p21 and β-actin antibody (Input). D, parental MCF-7 cells and doxorubicin-resistant and camptothecin-resistant clones after indicated gene silencing were seeded on 96-well plates for mammosphere culture as described. The mammospheres formed are imaged with ×10 objective. Representative images are shown. The average number of mammospheres from three different experiments is used for plotting the graph. E, parental MCF-7 cells and doxorubicin-resistant and camptothecin-resistant clones after the indicated gene silencing were seeded on 24-well plates for a soft agar colony assay. Representative images and the graph of average colonies counted in each group are shown (n = 3). F, the possible signaling involved in stem cell enrichment after chemotherapy is presented. Anticancer drugs eliminate most of the cells through classical caspase-mediated cell death, leaving some quiescent senescent-like cells. These senescent cells are characterized by high ROS, and they rarely enter into the cell cycle, which often culminates in death at mitosis by a caspase-mediated mechanism. Some cells appear to escape spontaneous cell death through the reactivation antioxidant system by stabilizing Nrf2 subsequent to reduced 26 S proteasome activity and by direct interaction with p21.

References

    1. Al-Hajj M., Wicha M. S., Benito-Hernandez A., Morrison S. J., Clarke M. F. (2003) Proc. Natl. Acad. Sci. U.S.A. 100, 3983–3988 - PMC - PubMed
    1. Singh S. K., Hawkins C., Clarke I. D., Squire J. A., Bayani J., Hide T., Henkelman R. M., Cusimano M. D., Dirks P. B. (2004) Nature 432, 396–401 - PubMed
    1. Ponti D., Costa A., Zaffaroni N., Pratesi G., Petrangolini G., Coradini D., Pilotti S., Pierotti M. A., Daidone M. G. (2005) Cancer Res. 65, 5506–5511 - PubMed
    1. Goodell M. A., McKinney-Freeman S., Camargo F. D. (2005) Methods Mol. Biol. 290, 343–352 - PubMed
    1. Ho M. M., Ng A. V., Lam S., Hung J. Y. (2007) Cancer Res. 67, 4827–4833 - PubMed

Publication types

MeSH terms