

Early neural and vascular changes in the adolescent type 1 and type 2 diabetic retina
- PMID: 21878857
- PMCID: PMC3235228
- DOI: 10.1097/IAE.0b013e318219deac
Early neural and vascular changes in the adolescent type 1 and type 2 diabetic retina
Abstract
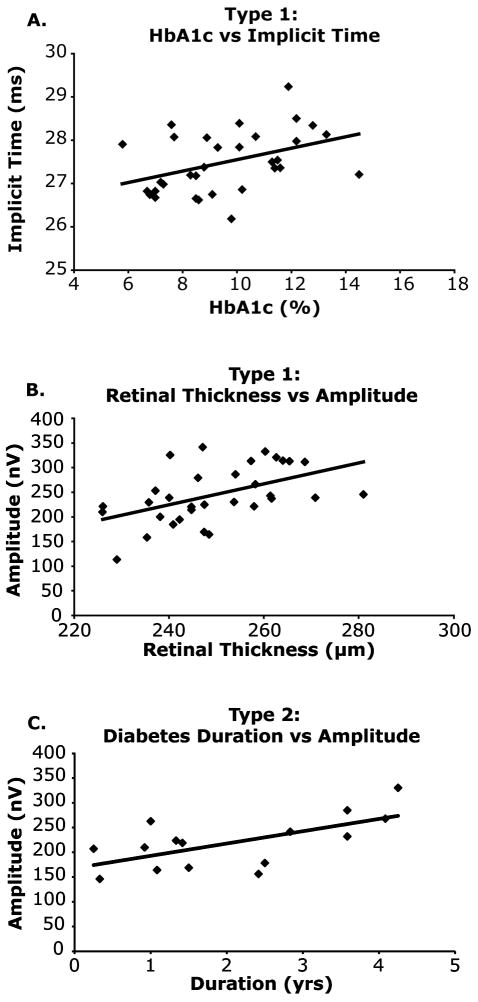
Purpose: This cross-sectional study examines the existence and frequency of functional and structural abnormalities in the adolescent Type 1 diabetic retina. We also compare the results with those of adolescents with Type 2 diabetes.
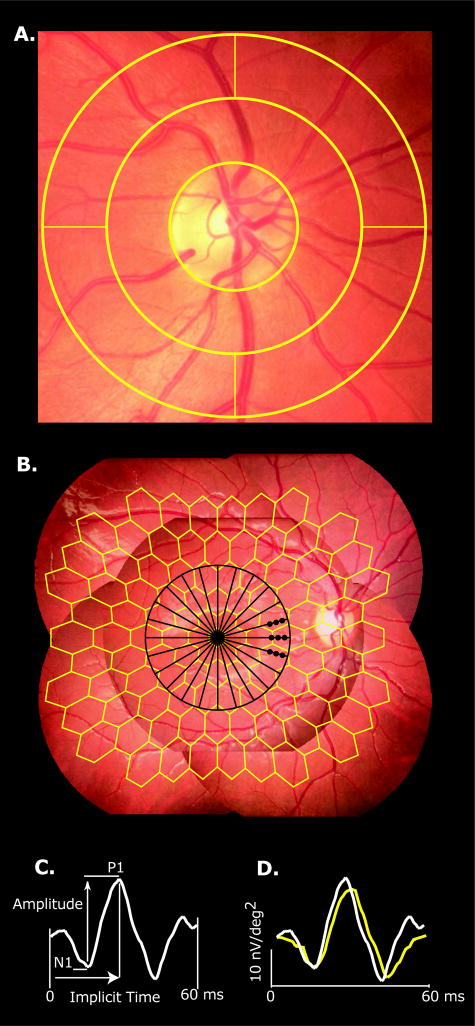
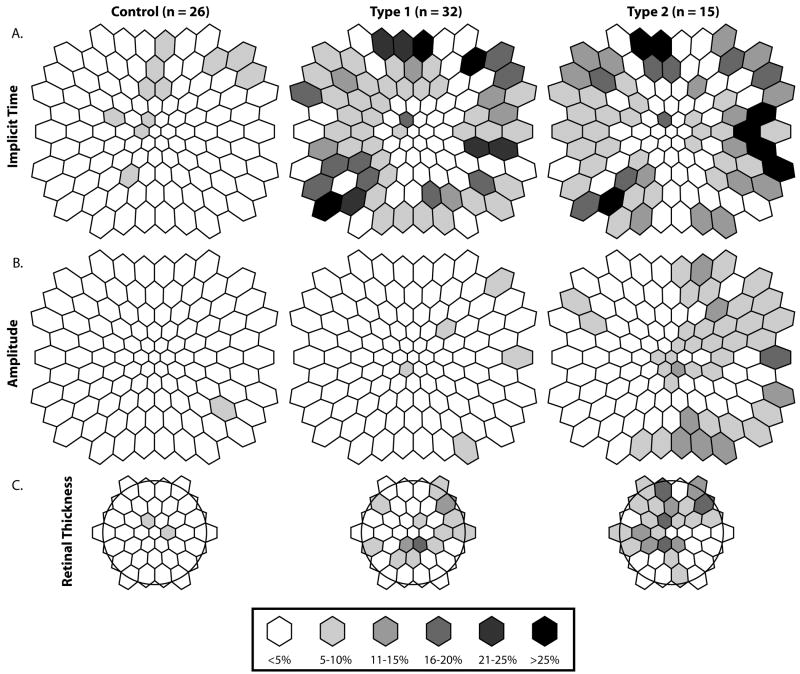
Methods: Thirty-two adolescents with Type 1 diabetes (5.7 ± 3.6 years; mean duration ± SD), 15 with Type 2 diabetes (2.1 ± 1.3 years), and 26 age-matched control subjects were examined. Multifocal electroretinogram responses from 103 retinal regions were recorded. Optical coherence tomography was used to measure retinal thickness. Vascular diameter around the optic nerve was also assessed.
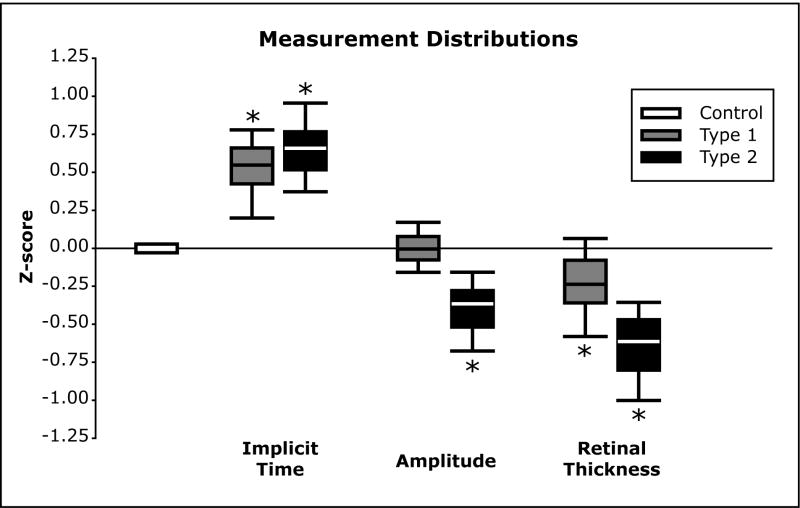
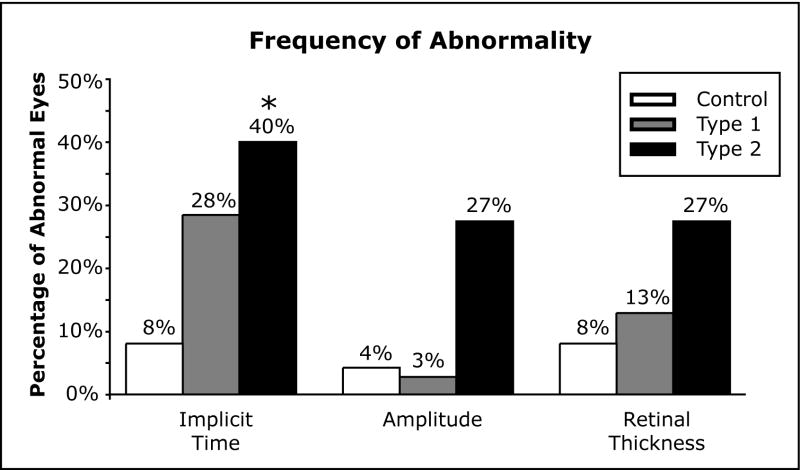
Results: Nine of the 32 (28%) adolescents with Type 1 diabetes and 6 of the 15 (40%) with Type 2 diabetes had significant multifocal electroretinogram implicit time delays compared with 2 of the 26 controls (8%). Retinal thicknesses in both patient groups were significantly (P ≤ 0.01) thinner than controls. The Type 2 group also showed significant (P ≤ 0.03) retinal venular dilation (235.8 ± 5.9 μm) compared with controls (219.6 ± 4.0 μm).
Conclusion: The present study illustrates that subtle but significant functional and structural changes occur very early in Type 1 diabetes. Adolescents with Type 2 diabetes appear to be more affected than those with Type 1 diabetes. Further longitudinal examination of the etiology and progression of these abnormalities is warranted.
Figures
Similar articles
-
Diabetic macular morphology changes may occur in the early stage of diabetes.BMC Ophthalmol. 2016 Jan 18;16:12. doi: 10.1186/s12886-016-0186-4. BMC Ophthalmol. 2016. PMID: 26781272 Free PMC article.
-
Associations between local retinal thickness and function in early diabetes.Invest Ophthalmol Vis Sci. 2012 Sep 12;53(10):6122-8. doi: 10.1167/iovs.12-10293. Invest Ophthalmol Vis Sci. 2012. PMID: 22871830 Free PMC article.
-
Adolescents with Type 2 diabetes: early indications of focal retinal neuropathy, retinal thinning, and venular dilation.Retina. 2009 May;29(5):618-26. doi: 10.1097/IAE.0b013e31819a988b. Retina. 2009. PMID: 19262432 Free PMC article.
-
Early retinal neurovascular impairment in patients with diabetes without clinically detectable retinopathy.Br J Ophthalmol. 2019 Dec;103(12):1747-1752. doi: 10.1136/bjophthalmol-2018-313582. Epub 2019 Jan 23. Br J Ophthalmol. 2019. PMID: 30674454
-
A multifocal electroretinogram model predicting the development of diabetic retinopathy.Prog Retin Eye Res. 2006 Sep;25(5):425-48. doi: 10.1016/j.preteyeres.2006.07.001. Epub 2006 Sep 1. Prog Retin Eye Res. 2006. PMID: 16949855 Free PMC article. Review.
Cited by
-
Correlations between Retinal Arterial Morphometric Parameters and Neurodegeneration in Patients with Type 2 Diabetes Mellitus with No or Mild Diabetic Retinopathy.Medicina (Kaunas). 2021 Mar 5;57(3):244. doi: 10.3390/medicina57030244. Medicina (Kaunas). 2021. PMID: 33807881 Free PMC article.
-
Optimal treatment of diabetic retinopathy.Ther Adv Endocrinol Metab. 2013 Apr;4(2):61-71. doi: 10.1177/2042018813477886. Ther Adv Endocrinol Metab. 2013. PMID: 23626903 Free PMC article.
-
The association between retinal vascular geometry changes and diabetic retinopathy and their role in prediction of progression--an exploratory study.BMC Ophthalmol. 2014 Jul 7;14:89. doi: 10.1186/1471-2415-14-89. BMC Ophthalmol. 2014. PMID: 25001248 Free PMC article.
-
Diabetic Retinopathy-Update on Prevention Techniques, Present Therapies, and New Leads.US Ophthalmic Rev. 2014;7(1):54-58. doi: 10.17925/usor.2014.07.01.54. US Ophthalmic Rev. 2014. PMID: 25419235 Free PMC article.
-
Metabolic Syndrome Triggered by Fructose Diet Impairs Neuronal Function and Vascular Integrity in ApoE-KO Mouse Retinas: Implications of Autophagy Deficient Activation.Front Cell Dev Biol. 2020 Oct 8;8:573987. doi: 10.3389/fcell.2020.573987. eCollection 2020. Front Cell Dev Biol. 2020. PMID: 33154969 Free PMC article.
References
-
- NIDDK. National Institute of Diabetes and Digestive and Kidney Diseases (NIDDK); Diabetes Fact Sheet. http://diabetes.niddk.nih.gov/dm/pubs/statistics/ - PubMed
-
- Mokdad AH, Bowman BA, Ford ES, et al. The continuing epidemics of obesity and diabetes in the United States. Jama. 2001;286(10):1195–1200. - PubMed
-
- Mokdad AH, Ford ES, Bowman BA, et al. The continuing increase of diabetes in the US. Diabetes Care. 2001;24(2):412. - PubMed
-
- Pinhas-Hamiel O, Dolan LM, Daniels SR, et al. Increased incidence of non-insulin-dependent diabetes mellitus among adolescents. J Pediatr. 1996;128(5 Pt 1):608–615. - PubMed
-
- Fagot-Campagna A, Pettitt DJ, Engelgau MM, et al. Type 2 diabetes among North American children and adolescents: an epidemiologic review and a public health perspective. J Pediatr. 2000;136(5):664–672. - PubMed
Publication types
MeSH terms
Grants and funding
LinkOut - more resources
Full Text Sources
Medical
