

Human metabolic profiles are stably controlled by genetic and environmental variation
- PMID: 21878913
- PMCID: PMC3202796
- DOI: 10.1038/msb.2011.57
Human metabolic profiles are stably controlled by genetic and environmental variation
Abstract
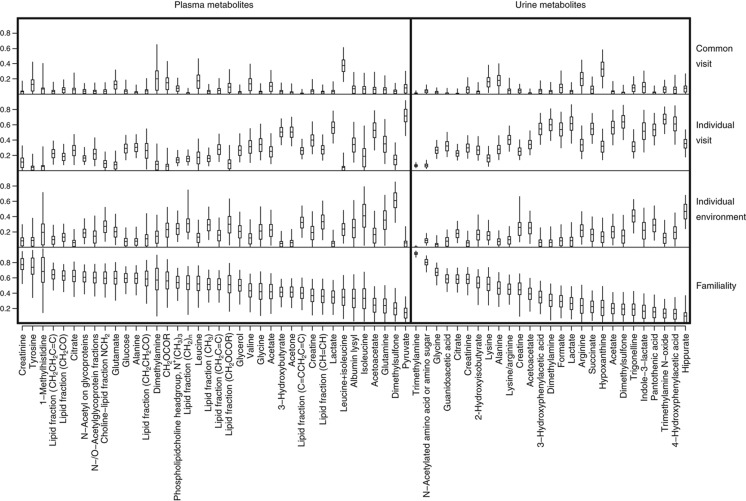
¹H Nuclear Magnetic Resonance spectroscopy (¹H NMR) is increasingly used to measure metabolite concentrations in sets of biological samples for top-down systems biology and molecular epidemiology. For such purposes, knowledge of the sources of human variation in metabolite concentrations is valuable, but currently sparse. We conducted and analysed a study to create such a resource. In our unique design, identical and non-identical twin pairs donated plasma and urine samples longitudinally. We acquired ¹H NMR spectra on the samples, and statistically decomposed variation in metabolite concentration into familial (genetic and common-environmental), individual-environmental, and longitudinally unstable components. We estimate that stable variation, comprising familial and individual-environmental factors, accounts on average for 60% (plasma) and 47% (urine) of biological variation in ¹H NMR-detectable metabolite concentrations. Clinically predictive metabolic variation is likely nested within this stable component, so our results have implications for the effective design of biomarker-discovery studies. We provide a power-calculation method which reveals that sample sizes of a few thousand should offer sufficient statistical precision to detect ¹H NMR-based biomarkers quantifying predisposition to disease.
Conflict of interest statement
The authors declare that they have no conflict of interest.
Figures
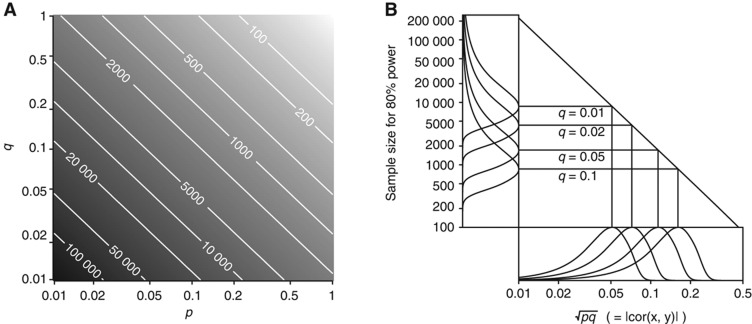
 . Calculations were based on the study attaining 80% power to reject H0:ρ=0 at a 10−4 level of significance (a Bonferroni-corrected significance level of 0.05, assuming that 500 metabolite peaks were tested for disease association). (A) Sample size as a function of p and q. Darker grey represents a larger required sample size (the colour scale is indicated by labelled contour lines on the plot). (B) Sample sizes for the discovery of 1H NMR-based urine biomarkers. Bottom panel (annotated ‘
 ’): Probability distributions on the magnitude of the underlying correlation (on logarithmic scale) between urinary metabolite concentration, x, and the disease phenotype, y. The probability distribution on p (not shown) was constructed using (for upper bounds) the current paper's estimates of the stable proportion of variation for peaks in the urine data (details are in Results). The proportion of disease risk explained, q, was fixed at four different values (annotated on plot). Main panel (annotated with four different values for q): Relationship between the underlying (x, y) correlation, and the sample size required for effect detection (both on logarithmic scale). Left panel (annotated ‘Sample Size for 80% Power’): Probability distribution on sample size (on logarithmic scale) required for effect detection, mapped from the correlation distributions in the bottom panel.
References
-
- Ala-Korpela M (2008) Critical evaluation of 1H NMR metabonomics of serum as a methodology for disease risk assessment and diagnostics. Clin Chem Lab Med 46: 27–42 - PubMed
-
- Bathum L, Fagnani C, Christiansen L, Christensen K (2004) Heritability of biochemical kidney markers and relation to survival in the elderly—results from a Danish population-based twin study. Clin Chim Acta 349: 143–150 - PubMed
-
- Bollard M, Stanley E, Lindon J, Nicholson J, Holmes E (2005) NMR-based metabonomic approaches for evaluating physiological influences on biofluid composition. NMR Biomed 18: 143–162 - PubMed
-
- Chadeau-Hyam M, Ebbels T, Brown I, Chan Q, Stamler J, Huang CC, Daviglus M, Ueshima H, Zhao L, Holmes E, Nicholson J, Elliott P, De Iorio M (2010) Metabolic profiling and the metabolome-wide association study: significance level for biomarker identification. J Proteome Res 9: 4620–4627 - PMC - PubMed
Publication types
MeSH terms
Substances
Grants and funding
LinkOut - more resources
Full Text Sources
Other Literature Sources
