. 2011 Aug 30:7:526.
doi: 10.1038/msb.2011.59.

Cellular reprogramming by the conjoint action of ERα, FOXA1, and GATA3 to a ligand-inducible growth state

Affiliations

Cellular reprogramming by the conjoint action of ERα, FOXA1, and GATA3 to a ligand-inducible growth state

Say Li Kong et al. Mol Syst Biol. .

Abstract

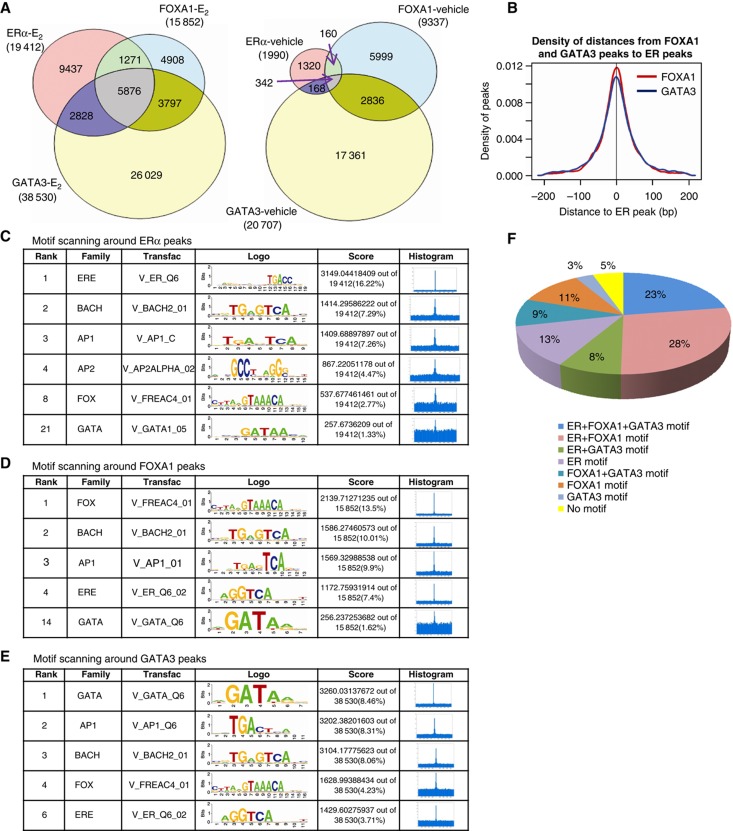
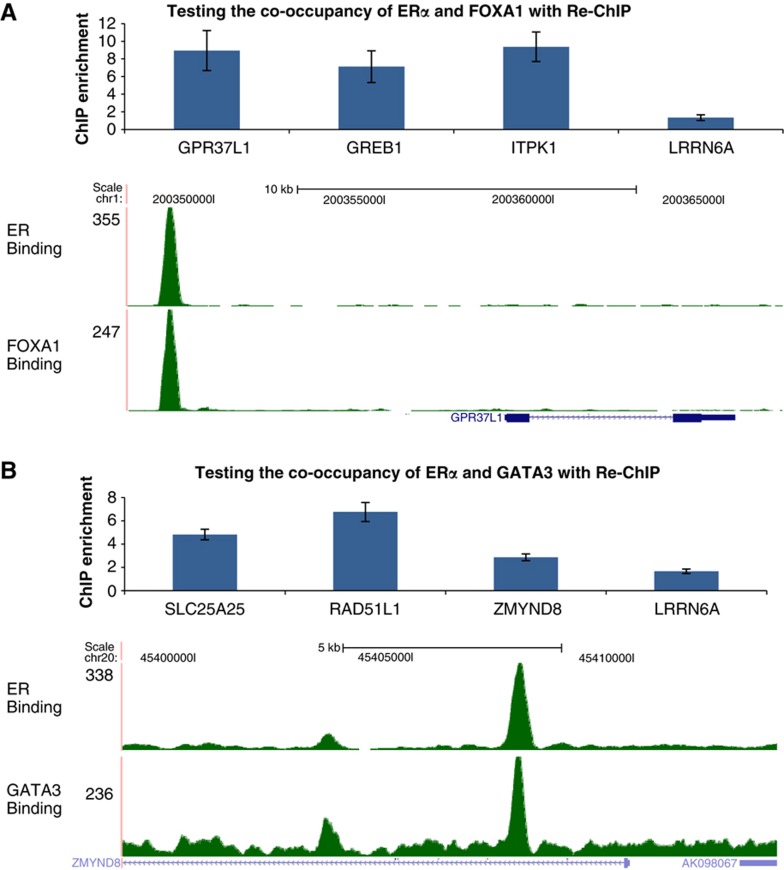
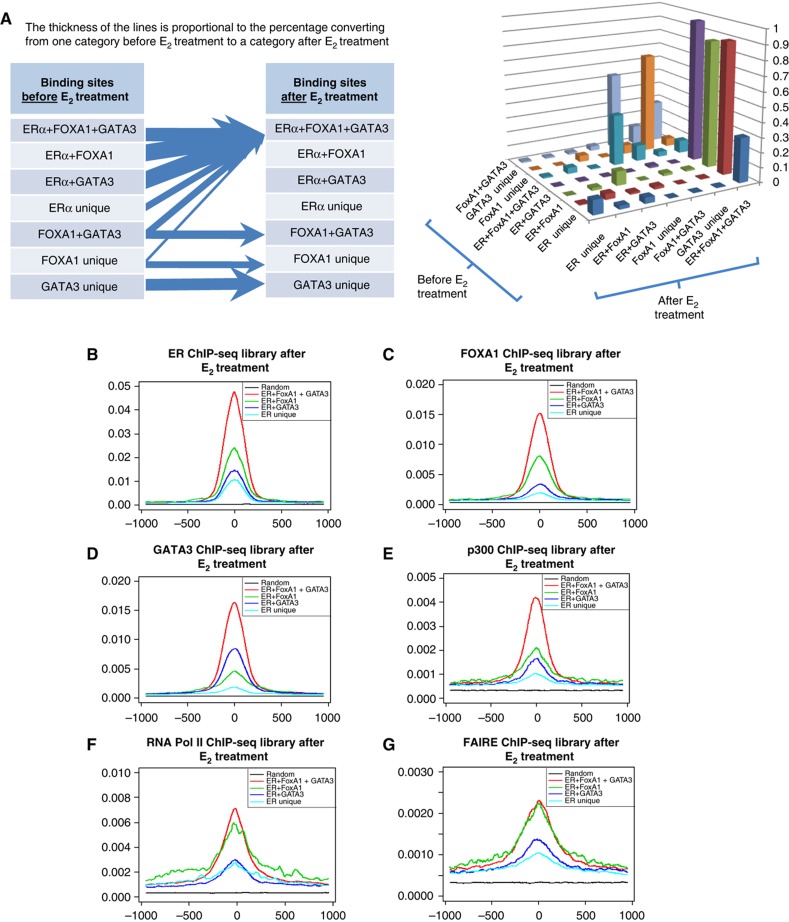
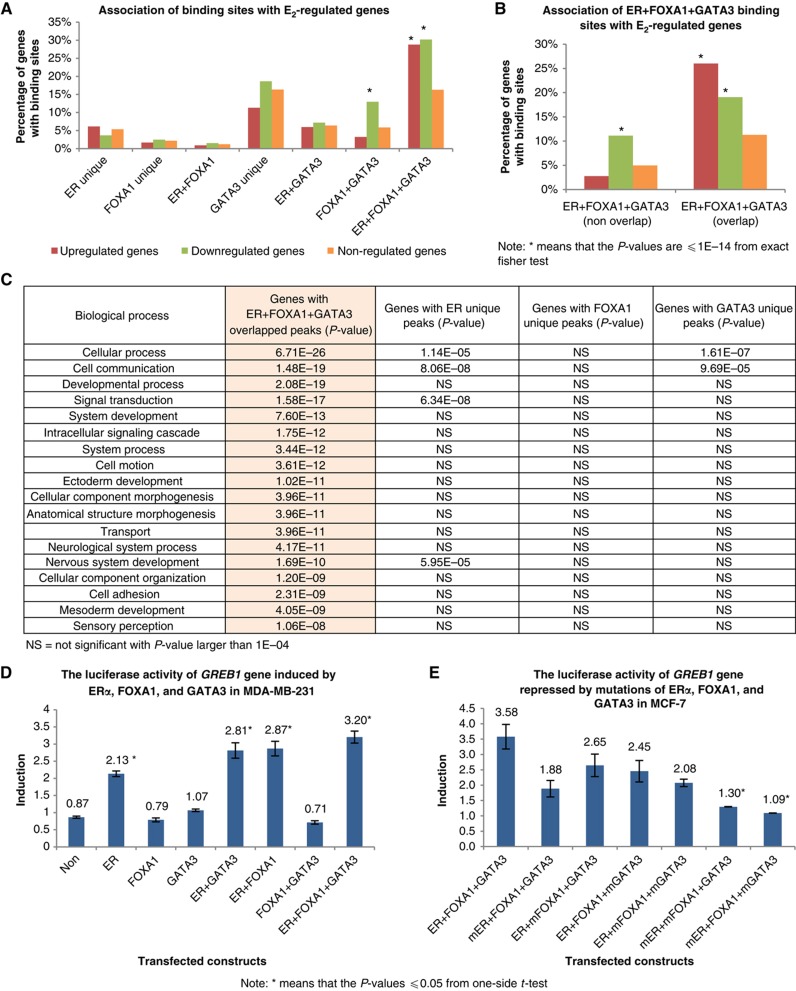
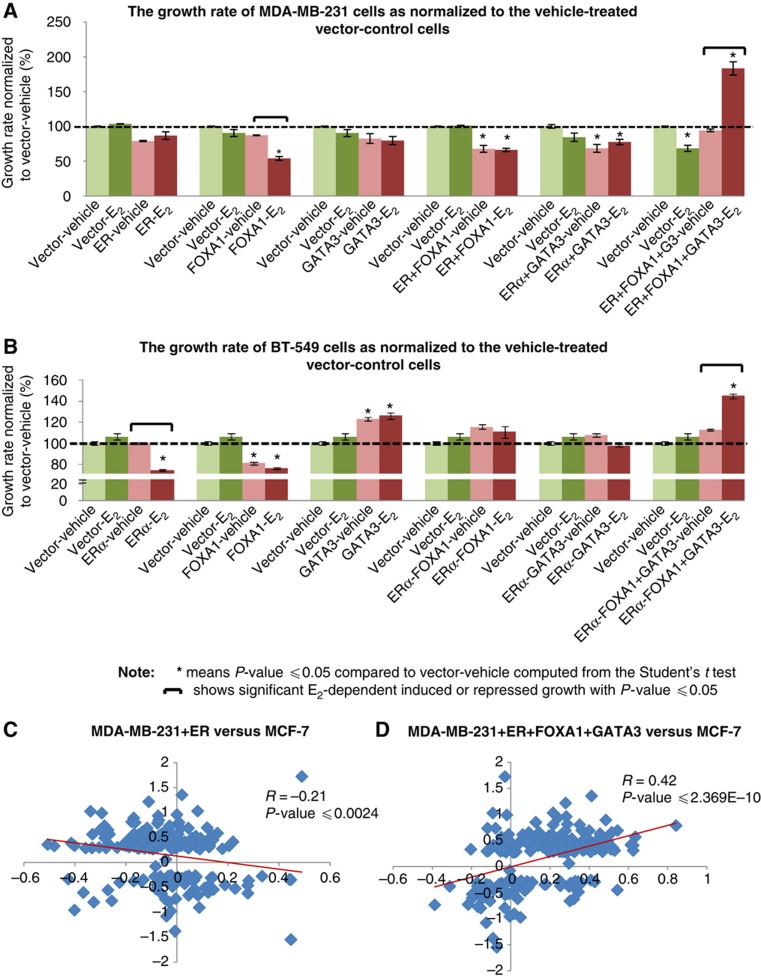
Despite the role of the estrogen receptor α (ERα) pathway as a key growth driver for breast cells, the phenotypic consequence of exogenous introduction of ERα into ERα-negative cells paradoxically has been growth inhibition. We mapped the binding profiles of ERα and its interacting transcription factors (TFs), FOXA1 and GATA3 in MCF-7 breast carcinoma cells, and observed that these three TFs form a functional enhanceosome that regulates the genes driving core ERα function and cooperatively modulate the transcriptional networks previously ascribed to ERα alone. We demonstrate that these enhanceosome occupied sites are associated with optimal enhancer characteristics with highest p300 co-activator recruitment, RNA Pol II occupancy, and chromatin opening. Most importantly, we show that the transfection of all three TFs was necessary to reprogramme the ERα-negative MDA-MB-231 and BT-549 cells to restore the estrogen-responsive growth resembling estrogen-treated ERα-positive MCF-7 cells. Cumulatively, these results suggest that all the enhanceosome components comprising ERα, FOXA1, and GATA3 are necessary for the full repertoire of cancer-associated effects of the ERα.


Conflict of interest statement

The authors declare that they have no conflict of interest.

Figures

Figure 1
Figure 1
The repertoire of ERα, FOXA1, and GATA3 in vivo bindings by massively parallel ChIP-seq approach. (A) Venn diagrams of in vivo bindings for ERα, FOXA1, and GATA3 upon and before E2 stimulation in MCF-7 cells. (B) The distance distribution of FOXA1 and GATA3 bindings around ERα sites, demonstrating that FOXA1 and GATA3 have similar distance distribution around ERα sites. (CE) Motif scanning around ERα, FOXA1, and GATA3 peaks separately. (F) The distribution of ERα, FOXA1, and GATA3 motifs around ERα binding sites.
Figure 2
Figure 2
The interaction between ERα, FOXA1, and GATA3 in breast cancer genome. The co-occupancy of ERα+FOXA1 (A) and ERα+GATA3 (B) to the target cis-regulatory regions as validated by sequential Re-ChIP assay. Genes nearby are used to label the peaks, and the tag densities around gene GPR37L1 with ERα+FOXA1 peaks and gene ZMYND8 with ERα+GATA3 peaks are shown as examples. A site near LRRN6A gene with only unique ERα binding is recruited as a negative control for the sequential Re-ChIP assay. The ChIP enrichment was computed by comparing with the IgG pull-down control. Mean values of at least two independent experiments are compared and standard errors are shown.
Figure 3
Figure 3
The progressive recruitment of ERα and FOXA1 to the cis-regulatory elements. (A) Venn diagram of ERα binding sites with vehicle, ERα binding sites after E2 treatment, FOXA1 binding sites with vehicle, and FOXA1 binding sites after E2 treatment. (B) The recruitment of ERα after FOXA1 binding in the synchronized MCF-7 cells upon E2 stimulation as validated by ChIP-qPCR in various time points. Two independent experiments have consistent results. Mean values and standard errors are shown. (C) The recruitment of FOXA1 after ERα binding in the synchronized MCF-7 cells upon E2 stimulation as validated by ChIP-qPCR in various time points. Two independent experiments have consistent results. Mean values and standard errors are shown.
Figure 4
Figure 4
The formation of enhanceosome consists of ERα, FOXA1, and GATA3. (A) The dynamics of TFs binding before and after E2 stimulation. The different categories of ERα, FOXA1, and GATA3 binding sites in the Venn diagram before E2 stimulation will converge to ERα+FOXA1+GATA3 overlapped binding sites after E2 stimulation. (BD) The enhanced ERα, FOXA1, and GATA3 occupancy at the ERα+FOXA1+GATA3 sites. The tag profiles around the binding sites are enriched after E2 stimulation (see Supplementary Figure S3 for tag profiles before E2 treatment). The tag profile is normalized by the number of peaks in the category and the sequencing depth from the corresponding ChIP-seq library. (E) The enhanced p300 co-activator recruitment to enhanceosome sites after E2 stimulation. (F) The highest association of RNA Pol II recruitment with enhanceosome sites after E2 stimulation. (G) The enhanceosome is correlated with chromatin opening as measured by FAIRE after E2 stimulation.
Figure 5
Figure 5
The impact of enhanceosome on gene regulation. (A) The association of ERα, FOXA1, and GATA3 bindings with E2-regulated genes. The percentages of the upregulated and downregulated genes are significant from genes associated with ERα+FOXA1+GATA3 overlapped binding sites. (B) The association of TF bindings with E2-regulated genes in two different configurations where conjoint ERα+FOXA1+GATA3 bindings with overlapping occupancy by all three TFs and those non-overlapping individual ERα, FOXA1, and GATA3 bindings in close proximity within 20 kb of a TSS. (C) Gene ontology analysis of genes associated with different categories of ERα, FOXA1, and GATA3 bindings. The genes associated with ERα+FOXA1+GATA3 overlapped binding sites have significant functions, compared with genes only with individual unique ERα, FOXA1, and GATA3 bindings. (D) The presence of ERα, FOXA1, and GATA3 has induced the luciferase activity of GREB1 gene in MDA-MB-231 cells. The basal luciferase activity of GREB1 in MDA-MB-231 cells is used as the control reference. Mean values of three independent experiments are compared and standard errors are shown. (E) The loss of FOXA1 and/or GATA3 bindings has reduced the luciferase activity of GREB1 gene in MCF-7 cells. ‘mER’, ‘mFOXA1’, and ‘mGATA3’ denote mutated ERE, FOXA1, and GATA3 motif sequences around their respective binding sites near the GREB1 promoter. The basal luciferase activity of GREB1 in MCF-7 wild-type cells is served as the control reference. Mean values of three independent experiments are compared and standard errors are shown.
Figure 6
Figure 6
FOXA1 and GATA3 are essential components of E2-induced ERα-response casette. (A) The growth of MDA-MB-231 cells transfected with different combinations of TFs relative to the vehicle-treated MDA-MB-231 vector control cells at the final day of WST-1 measurement. (B) The recapitulation of reprogramming work in another ERα-negative BT-549 cells. The growth of BT-549 cells tranfected with different combinations of TFs relative to the vehicle-treated BT-549 vector control cells at the final day of WST-1 assay. (C) The comparison of gene profiles in the reprogrammed MDA-MB-231 and MCF-7 cells. The gene profiles of ERα-only MDA-MB-231 cells show weak correlation with the expression profiles of MCF-7 cells. (D) The ERα+FOXA1+GATA3-expressing MDA-MB-231 cells display good correlation with the expression profile of ERα-positive MCF-7 cells. The P-value for the differences between the two correlation coefficient stated in (C) and (D) is ⩽2.08E−11.

References

    1. Asselin-Labat ML, Sutherland KD, Barker H, Thomas R, Shackleton M, Forrest NC, Hartley L, Robb L, Grosveld FG, van der Wees J, Lindeman GJ, Visvader JE (2007) Gata-3 is an essential regulator of mammary-gland morphogenesis and luminal-cell differentiation. Nat Cell Biol 9: 201–209 - PubMed
    1. Badve S, Turbin D, Thorat MA, Morimiya A, Nielsen TO, Perou CM, Dunn S, Huntsman DG, Nakshatri H (2007) FOXA1 expression in breast cancer—correlation with luminal subtype A and survival. Clin Cancer Res 13: 4415–4421 - PubMed
    1. Bernado GM, Lozada KL, Miedler JD, Harburg G, Hewitt SC, Mosley JD, Godwin AK, Korach KS, Visvader JE, Kaestner KH, Abdul-Karim FW, Montana MM, Keri RA (2010) FOXA1 is an essential determinant of ERa expression and mammary ductal morphogenesis. Development 137: 2045–2054 - PMC - PubMed
    1. Bhat-Nakshatri P, Wang G, Appaiah H, Luktuke N, Carroll JS, Geistlinger TR, Brown M, Badve S, Liu Y, Nakshatri H (2008) AKT alters genome-wide estrogen receptor a binding and impacts estrogen signaling in breast cancer. Mol Cell Biol 28: 7487–7503 - PMC - PubMed
    1. Carroll JS, Liu XS, Brodsky AS, Li W, Meyer CA, Szary AJ, Eeckhoute J, Shao W, Hestermann EV, Geistlinger TR, Fox EA, Silver PA, Brown M (2005) Chromosome-wide mapping of estrogen receptor binding reveals long-range regulation requiring the forkhead protein FoxA1. Cell 122: 33–43 - PubMed

Publication types

MeSH terms