. 2012 Jan 1;441(1):285-96.
doi: 10.1042/BJ20110512.

Reduction in BACE1 decreases body weight, protects against diet-induced obesity and enhances insulin sensitivity in mice

Affiliations

Reduction in BACE1 decreases body weight, protects against diet-induced obesity and enhances insulin sensitivity in mice

Paul J Meakin et al. Biochem J. .

Abstract

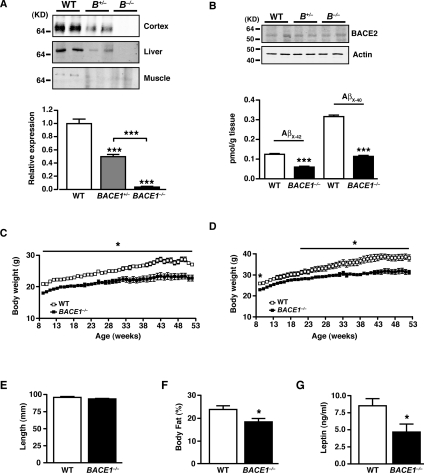
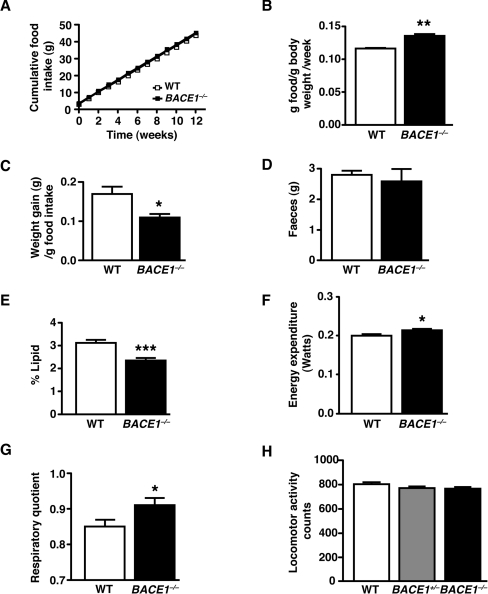
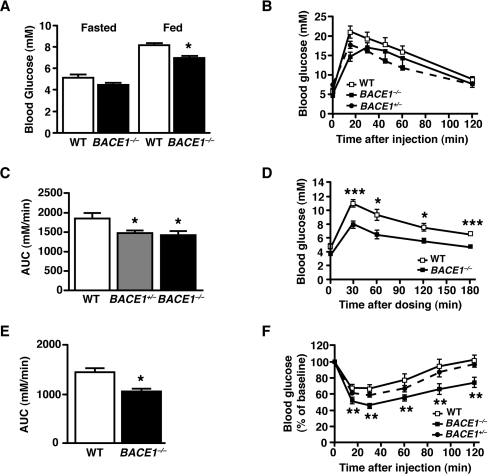
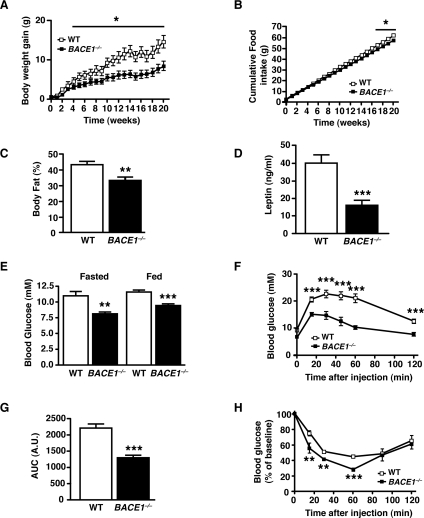
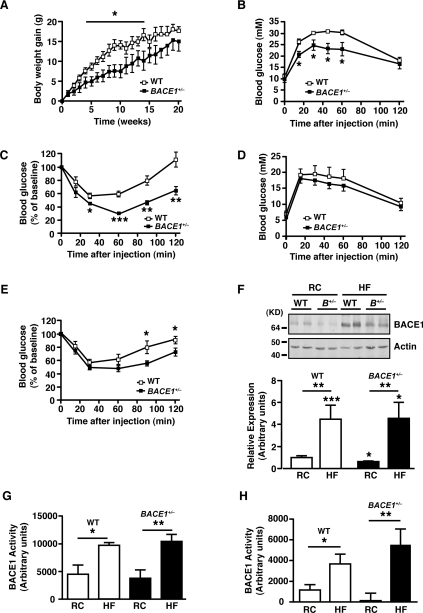
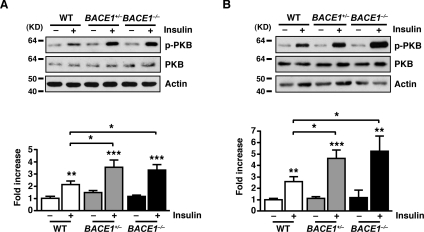
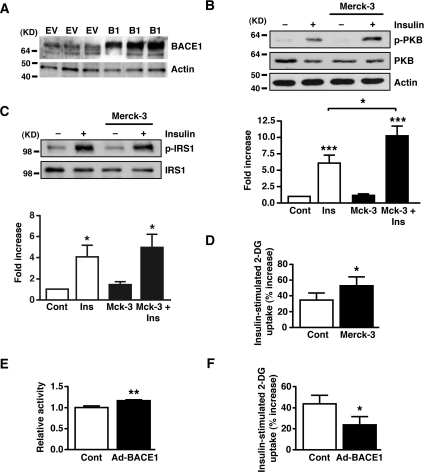
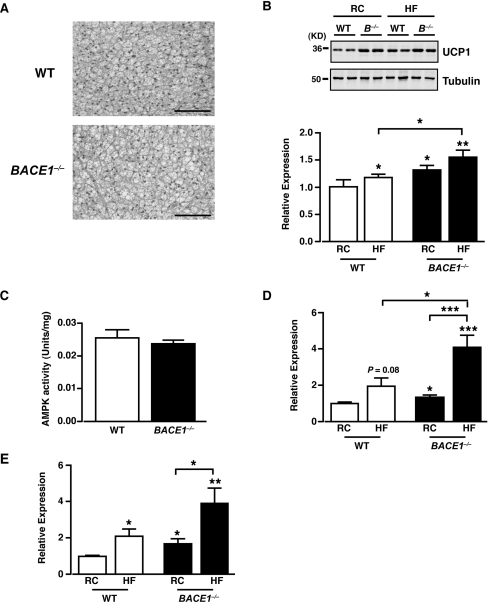
Insulin resistance and impaired glucose homoeostasis are important indicators of Type 2 diabetes and are early risk factors of AD (Alzheimer's disease). An essential feature of AD pathology is the presence of BACE1 (β-site amyloid precursor protein-cleaving enzyme 1), which regulates production of toxic amyloid peptides. However, whether BACE1 also plays a role in glucose homoeostasis is presently unknown. We have used transgenic mice to analyse the effects of loss of BACE1 on body weight, and lipid and glucose homoeostasis. BACE1-/- mice are lean, with decreased adiposity, higher energy expenditure, and improved glucose disposal and peripheral insulin sensitivity than wild-type littermates. BACE1-/- mice are also protected from diet-induced obesity. BACE1-deficient skeletal muscle and liver exhibit improved insulin sensitivity. In a skeletal muscle cell line, BACE1 inhibition increased glucose uptake and enhanced insulin sensitivity. The loss of BACE1 is associated with increased levels of UCP1 (uncoupling protein 1) in BAT (brown adipose tissue) and UCP2 and UCP3 mRNA in skeletal muscle, indicative of increased uncoupled respiration and metabolic inefficiency. Thus BACE1 levels may play a critical role in glucose and lipid homoeostasis in conditions of chronic nutrient excess. Therefore strategies that ameliorate BACE1 activity may be important novel approaches for the treatment of diabetes.


Figures

Figure 1
Figure 1. BACE1−/− mice exhibit reduced adiposity
(A) BACE1 protein levels in BACE1−/−, BACE1+/− and WT mice, as shown by representative immunoblots of mouse cerebral cortex, skeletal muscle and liver. The histogram (bottom panel) shows mean normalized levels of BACE1 in cortex from WT, BACE1+/− and BACE1−/− mice following 20 weeks fed on the regular chow diet. WT, n=11; BACE1+/−, n=11; BACE1−/−, n=12. (B) Representative immunoblots of BACE2 in WT, BACE1+/− and BACE1−/− mouse cerebral cortices. The histogram (bottom panel) shows levels of Aβx-42 and Aβx-40 in the cerebral cortex of WT and BACE1−/− mice. WT, n=5; BACE1−/−, n=6. Molecular mass is given in kDa on the left-hand side. Male (C) and female (D) body mass curves of age-matched WT littermate and BACE1−/− mice fed on a regular chow diet, monitored over a period of 45 weeks from 9 weeks of age. The results in (C) and (D) are means±S.E.M. from 9–12 animals of each genotype. (E) Male BACE1−/− mice have unaltered body length compared with the WT controls. WT, n=20; BACE1−/−, n=19. (F) Percentage body fat determined by qMR imaging in 8-month-old male WT and BACE1−/− mice. WT, n=5; BACE1−/−, n=7. (G) Fasting blood leptin levels in 8-month-old male mice of the indicated genotypes. WT, n=12; BACE1−/−, n=15. Results are means± S.E.M. *P<0.05; **P<0.01; ***P<0.001.
Figure 2
Figure 2. BACE1−/− mice have increased relative food intake and energy expenditure
(A) Cumulative food intake, measured over 12 weeks, in 3-month-old male mice of the indicated genotypes. (B) Food intake per mouse per week normalized by body mass (relative food intake). (C) BACE1−/− mice have decreased feed efficiency compared with the WT controls. Results in (AC) are from 5–7 animals of each genotype. (D) Mean mass of faeces over 24 h for WT and BACE1−/− mice. (E) Lipid content of faeces in WT and BACE1−/− mice. Results in (D) and (E) are from seven animals of each genotype. (F) Energy expenditure determined by indirect calorimetry in 8-month-old WT and BACE1−/− mice. (G), BACE1−/− mice have an increased RQ compared with the WT mice. Results in (F) and (G), WT, n=14 and BACE1−/−, n=12. (H) Effect of genotype on locomotor activity. WT, n=9; BACE1+/−, n=10; BACE1−/−, n=6. Results are means±S.E.M. *P<0.05; **P<0.01; ***P<0.001.
Figure 3
Figure 3. Improved insulin sensitivity and glucose homoeostasis in BACE1−/− mice
(A) Fasted and fed blood glucose levels in 8-month-old male mice of the indicated genotypes (n=11–18). (B) IGTTs were performed on 8-month-old male mice of the indicated genotypes (n=10–12). (C) Quantification of the AUC (area under the curve) for the total glycaemic excursions shown in (B). (D) OGTT in 12-month-old male WT and BACE1−/− mice with quantification of the total glycaemic excursion shown in (E). WT, n=11; BACE1−/−, n=9. (F) ITT for 8-month-old male mice of the indicated genotypes (n=12–17). Results are means±S.E.M. *P<0.05; **P<0.01; ***P<0.001.
Figure 4
Figure 4. HFD-fed BACE1−/− mice are less susceptible to weight gain and loss of glucose homoeostasis
(A) Body mass gain of age-matched male WT littermate and BACE1−/− mice fed on an HFD, monitored over a period of 20 weeks from 5 months-of-age. (B) Cumulative food intake, measured over 20 weeks, of age-matched male WT littermate and BACE1−/− mice fed on an HFD. Results in (A) and (B) are means±S.E.M. from 6–11 animals of each genotype. (C) The percentage body fat determined by qMR imaging in 10-month-old male WT and BACE1−/− mice following 20 weeks of the HFD. WT, n=7; BACE1−/−, n=11. (D) Fasting blood leptin levels in 10-month-old male mice of the indicated genotypes, following 20 weeks of a HFD. WT, n=11; BACE1−/−, n=11. (E) Fasting and fed blood glucose levels in 8-month-old male mice of the indicated genotypes, following 20 weeks on a HFD (n=7–11). (F) IGTTs were performed on 8-month-old male mice of the indicated genotypes following 20 weeks of the HFD. WT, n=7; BACE1−/−, n=5 (G) Quantification of the AUC (area under the curve) for the total glycaemic excursions shown in (F). (H) ITTs for 8-month-old male mice of the indicated genotypes, following 20 weeks of an HFD. WT, n=7; BACE1−/−, n=5. Results are means±S.E.M. *P<0.05; **P<0.01; ***P<0.001.
Figure 5
Figure 5. BACE1+/− mice show time-limited resistance to an HFD
(A) Body mass gain of age-matched male WT littermate and BACE1+/− mice fed on an HFD, monitored over a period of 20 weeks from 3 months of age. Note that P<0.05 for weeks 4–14 only. WT, n=8; BACE1+/−, n=7. IGTT (B) and ITT (C) for WT and BACE1+/− mice, after 10 weeks on an HFD. IGTT (D) and ITT (E) for WT and BACE1+/− mice, after 20 weeks on an HFD. WT, n=8; BACE1+/−, n=7 for (B)–(E). (F) Representative immunoblots of BACE1 in skeletal muscle of male WT and BACE1+/− mice following 20 weeks on the regular chow (RC) diet or the HFD. The histogram shows mean normalized levels of BACE1 in skeletal muscle (n=9–15). Molecular mass is given in kDa on the left-hand side. BACE1 activity for skeletal muscle (G) and liver (H) of WT and BACE1+/− mice following 20 weeks on the regular chow diet or the HFD (n=6–11). Results are means±S.E.M. *P<0.05; **P<0.01; ***P<0.001.
Figure 6
Figure 6. Increased PKB phosphorylation by insulin in muscle and liver BACE1−/− mice
Representative immunoblots of insulin-stimulated phosphorylation of PKB at Ser473 from the skeletal muscle (A) and liver (B) of 16–20-week-old WT, BACE1+/− and BACE1−/− mice, 5 and 6 min after insulin injection respectively. The histograms below the immunoblots show the normalized means±S.E.M of the immunoblots for the skeletal muscle and liver of the indicated genotypes respectively. Results are means±S.E.M. from 7–19 animals of each genotype. *P<0.05; **P<0.01; ***P<0.001. Molecular mass is given in kDa on the left-hand side.
Figure 7
Figure 7. Inhibition of BACE1 increases insulin signalling in C2C12 muscle cells
(A) Representative immunoblots showing the presence of BACE1 protein in the mouse C2C12 skeletal muscle cell line under control conditions (EV) and following transfection with adenovirus containing Myc-His-tagged BACE1 (B1). (BD) Mouse C2C12 muscle cells were exposed to the BACE1 inhibitor Merck-3 for 24 h, prior to cells being stimulated with saline or insulin for 30 min. (B) Representative immunoblots of insulin-stimulated phosphorylation of PKB at Ser473 in treated and untreated C2C12 cells. The histograms show the normalized means±S.E.M. of the immunoblots (n=10). (C) Representative immunoblots of IRS-1 and phosphorylated IRS-1 at Tyr612 in treated and untreated C2C12 skeletal muscle cells. The histograms show the normalized means±S.E.M. of the immunoblots (n=8). Molecular mass is given in kDa on the left-hand side. (D) Insulin-stimulated 2-deoxyglucose uptake in treated and untreated C2C12 cells, expressed relative to the uptake in the absence of insulin (n=11). (E) Relative BACE1 activity in C2C12 cells transfected with empty vector (Cont) or Myc-His-tagged BACE1 (n=9). (F) Insulin-stimulated 2-deoxyglucose uptake in C2C12 cells, transfected with empty vector (Cont) or Myc-His-tagged BACE1, expressed relative to uptake in the absence of insulin (n=5). *P<0.05; **P<0.01; ***P<0.001.
Figure 8
Figure 8. Increased UCP levels in BACE1−/− mice
(A) H&E (haematoxylin and eosin) staining of BAT from WT and BACE1−/− mice fed on a regular chow diet for 20 weeks. Scale bar represents 50 μm. (B) Representative immunoblots of UCP1, with tubulin as loading control, from BAT of WT and BACE1−/− mice following 20 weeks on the regular chow diet and HFD. The histogram shows mean normalized UCP1 protein expression in WT and BACE1−/− BAT on regular and high-fat diet. Results are means±S.E.M. for 5–11 animals under each condition. Molecular mass is given in kDa on the left-hand side. (C) AMPK activity measured from skeletal muscle of WT and BACE1−/− mice following 20 weeks on the regular chow diet. WT, n=8; BACE1−/−, n=8. Mean normalized UCP2 mRNA (D) and UCP3 mRNA (E) expression in skeletal muscle of WT and BACE1−/− mice, following 20 weeks on the regular diet or the HFD. Results are means±S.E.M. from 8–14 animals under each condition. *P<0.05; **P<0.01; ***P<0.001.

References

    1. Biessels G. J., Staekenborg S., Brunner E., Brayne C., Scheltens P. Risk of dementia in diabetes mellitus: a systematic review. Lancet Neurol. 2006;5:64–74. - PubMed
    1. Janson J., Laedtke T., Parisi J. E., O'Brien P., Petersen R. C., Butler P. C. Increased risk of Type 2 diabetes in Alzheimer disease. Diabetes. 2004;53:474–481. - PubMed
    1. Luchsinger J. A., Gustafson D. R. Adiposity, Type 2 diabetes and Alzheimer's disease. J. Alzheimer's Dis. 2009;16:693–704. - PMC - PubMed
    1. Hassing L. B., Dahl A. K., Thorvaldsson V., Berg S., Gatz M., Pedersen N. L., Johansson B. Overweight in midlife and risk of dementia: a 40-year follow-up study. Int. J. Obes. 2009;33:893–898. - PMC - PubMed
    1. Craft S., Peskind E., Schwartz M. W., Schellenberg G. D., Raskind M., Porte D., Jr Cerebrospinal fluid and plasma insulin levels in Alzheimer's disease: relationship to severity of dementia and apolipoprotein E genotype. Neurology. 1998;50:164–168. - PubMed

Publication types

MeSH terms