Comparative Study
. 2011 Oct;20(19):4085-97.
doi: 10.1111/j.1365-294X.2011.05225.x. Epub 2011 Aug 31.

Genome-wide association analysis of clinical vs. nonclinical origin provides insights into Saccharomyces cerevisiae pathogenesis

Affiliations
Comparative Study

Genome-wide association analysis of clinical vs. nonclinical origin provides insights into Saccharomyces cerevisiae pathogenesis

L A H Muller et al. Mol Ecol. 2011 Oct.

Abstract

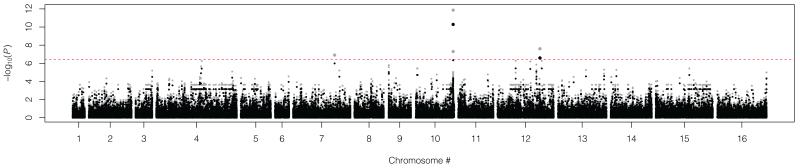
Because domesticated Saccharomyces cerevisiae strains have been used to produce fermented food and beverages for centuries without apparent health implications, S. cerevisiae has always been considered a Generally Recognized As Safe (GRAS) microorganism. However, the number of reported mucosal and systemic S. cerevisiae infections in the human population has increased and fatal infections have occurred even in relatively healthy individuals. In order to gain insight into the pathogenesis of S. cerevisiae and improve our understanding of the emergence of fungal pathogens, we performed a population-based genome-wide environmental association analysis of clinical vs. nonclinical origin in S. cerevisiae. Using tiling array-based, high-density genotypes of 44 clinical and 44 nonclinical S. cerevisiae strains from diverse geographical origins and source substrates, we identified several genetic loci associated with clinical background in S. cerevisiae. Associated polymorphisms within the coding sequences of VRP1, KIC1, SBE22 and PDR5, and the 5' upstream region of YGR146C indicate the importance of pseudohyphal formation, robust cell wall maintenance and cellular detoxification for S. cerevisiae pathogenesis, and constitute good candidates for follow-up verification of virulence and virulence-related factors underlying the pathogenicity of S. cerevisiae.


Figures

Figure 1
Figure 1
Results of a classical multidimensional scaling analysis performed using the cmdscale routine in R v2.9.0 (R Development Core Team, 2007) with a genetic distance matrix based on the pairwise identity-by-state (IBS) estimates, calculated using genotype data from 5,000 GeneChip® S. cerevisiae Tiling 1.0R single feature polymorphisms in approximate linkage equilibrium, among the segregants of 88 clinical and non-clinical Saccharomyces cerevisiae isolates; filled circles, nonclinical S. cerevisiae strains; filled triangles, clinical S. cerevisiae strains.
Figure 2
Figure 2
Manhattan plots illustrating the results of a genome-wide association analysis using Fisher exact tests (a) and Efficient Mixed-Model Association Expedited (EMMAX) (b) of clinical origin in Saccharomyces cerevisiae, with the x-axis representing genomic position and the y-axis indicating −log10(P) before (grey) and after (black) correction for confounding due to population structure by division with the inflation factor λ (λFisher = 1.67 and λEMMAX = 1.15); the dashed line corresponds to a nominal 5% significance threshold with Bonferroni correction for 135,771 tests and bold circles indicate a genome-wide significant association (P-value ≤ 3.68 × 10⁻⁷).
Figure 2
Figure 2
Manhattan plots illustrating the results of a genome-wide association analysis using Fisher exact tests (a) and Efficient Mixed-Model Association Expedited (EMMAX) (b) of clinical origin in Saccharomyces cerevisiae, with the x-axis representing genomic position and the y-axis indicating −log10(P) before (grey) and after (black) correction for confounding due to population structure by division with the inflation factor λ (λFisher = 1.67 and λEMMAX = 1.15); the dashed line corresponds to a nominal 5% significance threshold with Bonferroni correction for 135,771 tests and bold circles indicate a genome-wide significant association (P-value ≤ 3.68 × 10⁻⁷).
Figure 3
Figure 3
Magnifications of the genomic regions surrounding single feature polymorphisms (SFPs) that were found to be associated with clinical origin in Saccharomyces cerevisiae at a genome-wide significant level according to Fisher exact tests (a, c and f) and Efficient Mixed-Model Association Expedited (b, d and e); the x-axis indicates genomic position in basepair positions and the y-axis represents −log10(P) before (grey) and after (black) correction for confounding due to population structure by division with the inflation factor λ; the red dashed line corresponds to a nominal 5% significance threshold with Bonferroni correction for 135,771 tests and bold circles indicate a genome-wide significant association (P-value ≤ 3.68 × 10⁻⁷); the black dashed lines indicate the positions of the SFPs; heatmaps illustrate pairwise linkage disequilibria (LD) between the SFPs, measured as r2, and are shaded with a white-to-red gradient indicating low to high LD values.
Figure 3
Figure 3
Magnifications of the genomic regions surrounding single feature polymorphisms (SFPs) that were found to be associated with clinical origin in Saccharomyces cerevisiae at a genome-wide significant level according to Fisher exact tests (a, c and f) and Efficient Mixed-Model Association Expedited (b, d and e); the x-axis indicates genomic position in basepair positions and the y-axis represents −log10(P) before (grey) and after (black) correction for confounding due to population structure by division with the inflation factor λ; the red dashed line corresponds to a nominal 5% significance threshold with Bonferroni correction for 135,771 tests and bold circles indicate a genome-wide significant association (P-value ≤ 3.68 × 10⁻⁷); the black dashed lines indicate the positions of the SFPs; heatmaps illustrate pairwise linkage disequilibria (LD) between the SFPs, measured as r2, and are shaded with a white-to-red gradient indicating low to high LD values.
Figure 4
Figure 4
Log quantile-quantile plots of observed P-values generated by Fisher exact tests (a) and Efficient Mixed-Model Association Expedited (EMMAX) (b) versus expected P-values under the null hypothesis of no association before (black) and after (grey) correction for confounding due to population stratification by division with the inflation factor λ (λFisher = 1.67 and λemmax = 1.15).
Figure 4
Figure 4
Log quantile-quantile plots of observed P-values generated by Fisher exact tests (a) and Efficient Mixed-Model Association Expedited (EMMAX) (b) versus expected P-values under the null hypothesis of no association before (black) and after (grey) correction for confounding due to population stratification by division with the inflation factor λ (λFisher = 1.67 and λemmax = 1.15).

Similar articles

Cited by

References

    1. Bassetti S, Frei R, Zimmerli W. Fungemia with Saccharomyces cerevisiae after treatment with Saccharomyces boulardii. American Journal of Medicine. 1998;105:71–72. - PubMed
    1. Bengtsson H, Simpson K, Bullard J, Hansen K. Technical Report #745. Department of Statistics, University of California; Berkeley, USA: 2008. Aroma.affymetrix: a generic framework in R for analyzing small to very large Affymetrix data sets in bounded memory.
    1. Bolstad BM, Irizarry RA, Astrand M, Speed TP. A comparison of normalization methods for high density oligonucleotide array data based on bias and variance. Bioinformatics. 2003;19:185–193. - PubMed
    1. Borth N, Walther A, Reijnst P, Jorde S, Schaub Y, Wendland J. Candida albicans Vrp1 is required for polarized morphogenesis and interacts with Wal1 and Myo5. Microbiology. 2010;156:2962–2969. - PubMed
    1. Clemons KV, McCusker JH, Davis RW, Stevens DA. Comparative pathogenesis of clinical and nonclinical isolates of Saccharomyces cerevisiae. Journal of Infectious Diseases. 1994;169:859–67. - PubMed

Publication types

MeSH terms