Comparative Study
. 2011 Sep 1:11:210.
doi: 10.1186/1472-6963-11-210.

A cost comparison of electronic and hybrid data collection systems in Ontario during pandemic and seasonal influenza vaccination campaigns

Collaborators, Affiliations
Comparative Study

A cost comparison of electronic and hybrid data collection systems in Ontario during pandemic and seasonal influenza vaccination campaigns

Jennifer A Pereira et al. BMC Health Serv Res. .

Abstract

Background: During the pandemic (H1N1) 2009 influenza vaccination campaign, health regions in Canada collected client-level immunization data using fully electronic or hybrid systems, with the latter comprising both electronic and paper-based elements. The objective of our evaluation was to compare projected five-year costs associated with implementing these systems in Ontario public health units (PHUs) during pandemic and seasonal influenza vaccination campaigns.

Methods: Six PHUs provided equipment and staffing costs during the pandemic (H1N1) 2009 influenza vaccination campaign and staffing algorithms for seasonal campaigns. We standardized resources to population sizes 100,000, 500,000 and 1,000,000, assuming equipment lifetime of five years and public health vaccine administration rates of 18% and 2.5% for H1N1 and seasonal campaigns, respectively. Two scenarios were considered: Year 1 pandemic and Year 1 seasonal campaigns, each followed by four regular influenza seasons. Costs were discounted at 5%.

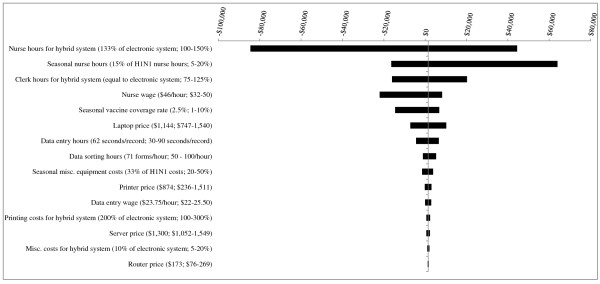
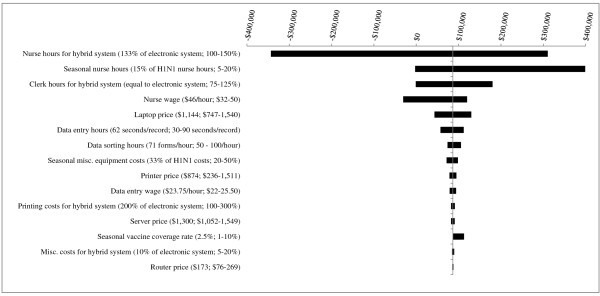
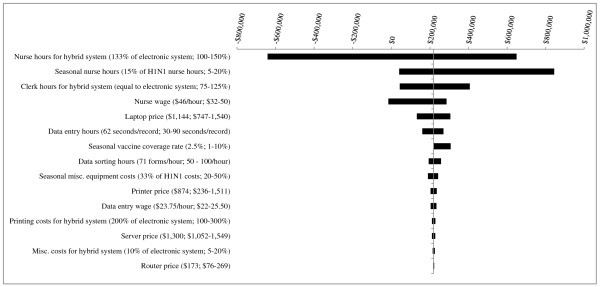
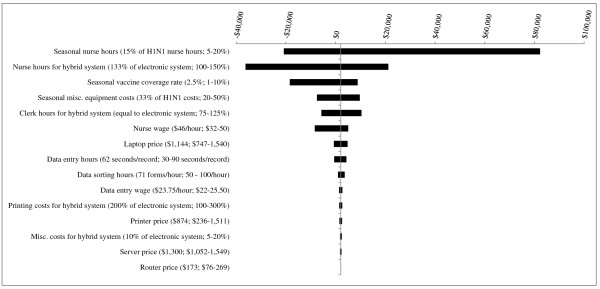
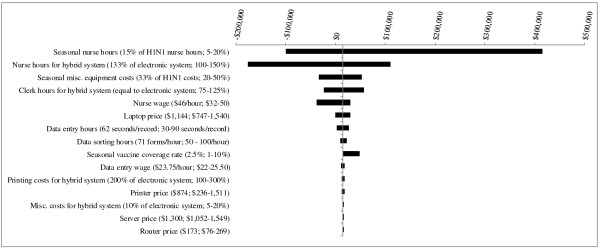
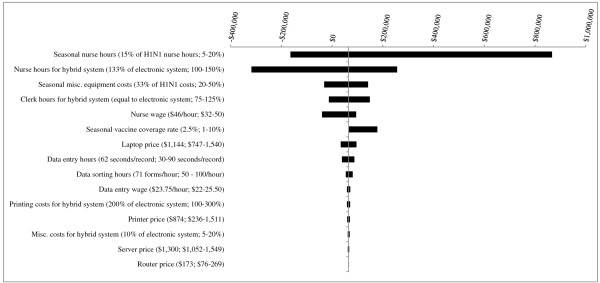
Results: Assuming a Year 1 pandemic, the five-year costs per capita for the electronic system decrease as PHU population size increases, becoming increasingly less costly than hybrid systems ($4.33 vs. $4.34 [100,000], $4.17 vs. $4.34 [500,000], $4.12 vs. $4.34 [1,000, 000]). The same trend is observed for the scenario reflecting five seasonal campaigns, with the electronic system being less expensive per capita than the hybrid system for all population sizes ($1.93 vs. $1.95 [100,000], $1.91 vs. $1.94 [500,000], $1.87 vs. $1.94 [1,000, 000]). Sensitivity analyses identified factors related to nurse hours as affecting the direction and magnitude of the results.

Conclusions: Five-year cost projections for electronic systems were comparable or less expensive than for hybrid systems, at all PHU population sizes. An intangible benefit of the electronic system is having data rapidly available for reporting.


Figures

Figure 1
Figure 1
Results of Sensitivity Analyses - Scenario 1 (1st year pandemic + 4 years of seasonal influenza vaccination campaigns) for PHU population of 100,000. The base case value and tested range is provided for each parameter. In the base case, the electronic system is less costly than the hybrid system, by a difference of $1,476. Where bars correspond to negative dollar values, variation in the parameter has resulted in the hybrid system becoming less costly than the electronic system.
Figure 2
Figure 2
Results of Sensitivity Analyses - Scenario 1 (1st year pandemic + 4 years of seasonal influenza vaccination campaigns) for PHU population of 500,000. The base case value and tested range is provided for each parameter. In the base case, the hybrid system is more costly than the electronic system, by a difference of $86,473. Where bars correspond to negative dollar values, variation in the parameter has resulted in the hybrid system becoming less costly than the electronic system.
Figure 3
Figure 3
Results of Sensitivity Analyses - Scenario 1 (1st year pandemic + 4 years of seasonal influenza vaccination campaigns) for PHU population of 1,000,000. The base case value and tested range is provided for each parameter. In the base case, the hybrid system is more costly than the electronic system, by a difference of $219,315. Where bars correspond to negative dollar values, variation in the parameter has resulted in the hybrid system becoming less costly than the electronic system.
Figure 4
Figure 4
Results of Sensitivity Analyses - Scenario 2 (5 years of seasonal influenza vaccination campaigns) for PHU population of 100,000. The base case value and tested range is provided for each parameter. In the base case, the electronic system is less costly than the hybrid system, by a difference of $2,068. Where bars correspond to negative dollar values, variation in the parameter has resulted in the hybrid system becoming less costly than the electronic system.
Figure 5
Figure 5
Results of Sensitivity Analyses - Scenario 2 (5 years of seasonal influenza vaccination campaigns) for PHU population of 500,000. The base case value and tested range is provided for each parameter. In the base case, the hybrid system is more costly than the electronic system, by a difference of $14,858. Where bars correspond to negative dollar values, variation in the parameter has resulted in the hybrid system becoming less costly than the electronic system.
Figure 6
Figure 6
Results of Sensitivity Analyses - Scenario 2 (5 years of seasonal influenza vaccination campaigns) for PHU population of 1,000,000. The base case value and tested range is provided for each parameter. In the base case, the hybrid system is more costly than the electronic system, by a difference of $64,939. Where bars correspond to negative dollar values, variation in the parameter has resulted in the hybrid system becoming less costly than the electronic system.

Similar articles

Cited by

References

    1. Writing team for the Public Health Agency of Canada/Canadian Institutes of Health Research Influenza Research Network Vaccine Coverage Theme Group. Why collect individual-level vaccination data? CMAJ. 2010;182(3):273–75. - PMC - PubMed
    1. Heidebrecht CL, Foisy J, Pereira JA, Quan SD, Willison DJ, Deeks SL, Finkelstein M, Crowcroft NS, Buckeridge DL, Guay M, Sikora CA, Kwong JC. Perceptions of Immunization Information Systems for Collecting Pandemic H1N1 Immunization Data within Canada's Public Health Community: A Qualitative Study. BMC Public Health. 2010;10:523. doi: 10.1186/1471-2458-10-523. - DOI - PMC - PubMed
    1. Canadian Agency for Drugs and Technologies in Health. Guidelines for the Economic Evaluation of Health Technologies. 2006. http://www.cadth.ca/media/pdf/186_EconomicGuidelines_e.pdf Accessed Dec 21, 2010.
    1. Pereira JA, Quach S, Heidebrecht CL, Foisy J, Quan SD, Finkelstein M, Sikora CA, Bettinger JA, Buckeridge DL, McCarthy A, Deeks S, Kwong JC. Pan-Canadian assessment of pandemic immunization data collection: study methodology. BMC Medical Research Methodology. 2010;10:51. - PMC - PubMed
    1. Quach S, Hamid JS, Pereira JA, Heidebrecht CL, Foisy J, Bettinger JA, Rosella L, Crowcroft NS, Deeks SL, Quan SD, Finkelstein M, Guay M, Buckeridge DL, Sikora CA, Kwong JC. Time and motion study to compare electronic and hybrid data collection systems during the pandemic (H1N1) 2009 influenza vaccination campaign. Vaccine. 2011;29(10):1997–2003. doi: 10.1016/j.vaccine.2010.09.016. - DOI - PubMed

Publication types

MeSH terms

Substances