. 2011 Dec;39(22):9633-48.
doi: 10.1093/nar/gkr682. Epub 2011 Aug 31.

Far upstream element binding protein 1 binds the internal ribosomal entry site of enterovirus 71 and enhances viral translation and viral growth

Affiliations

Far upstream element binding protein 1 binds the internal ribosomal entry site of enterovirus 71 and enhances viral translation and viral growth

Peng-Nien Huang et al. Nucleic Acids Res. 2011 Dec.

Abstract

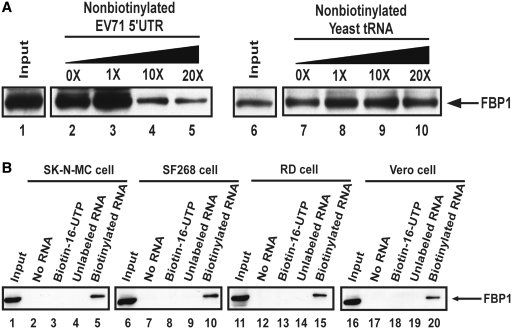
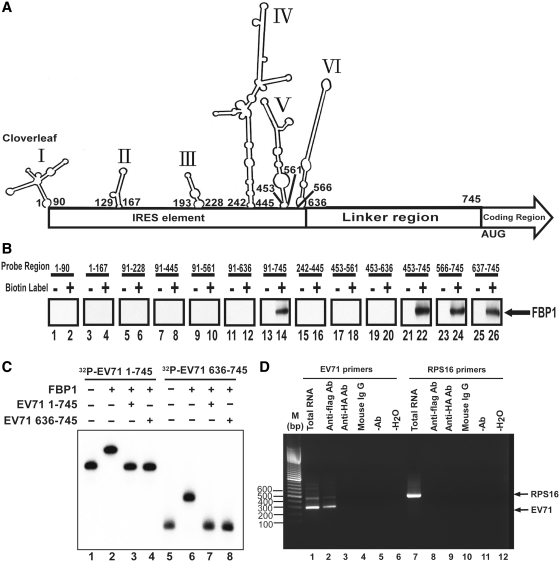
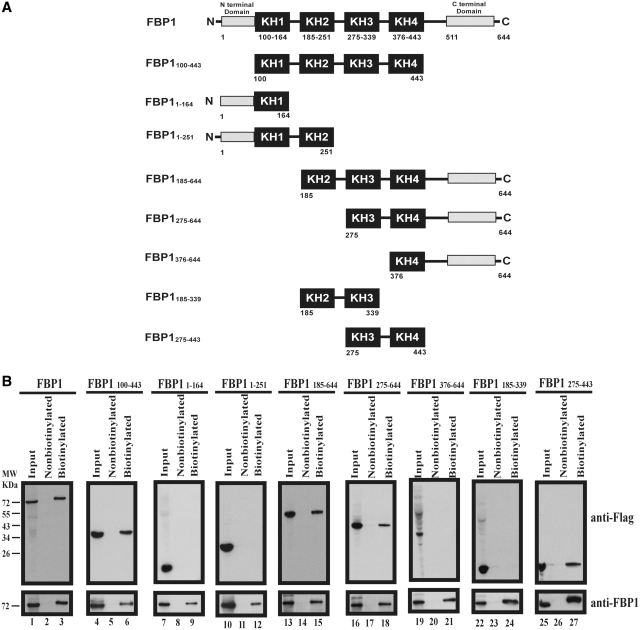
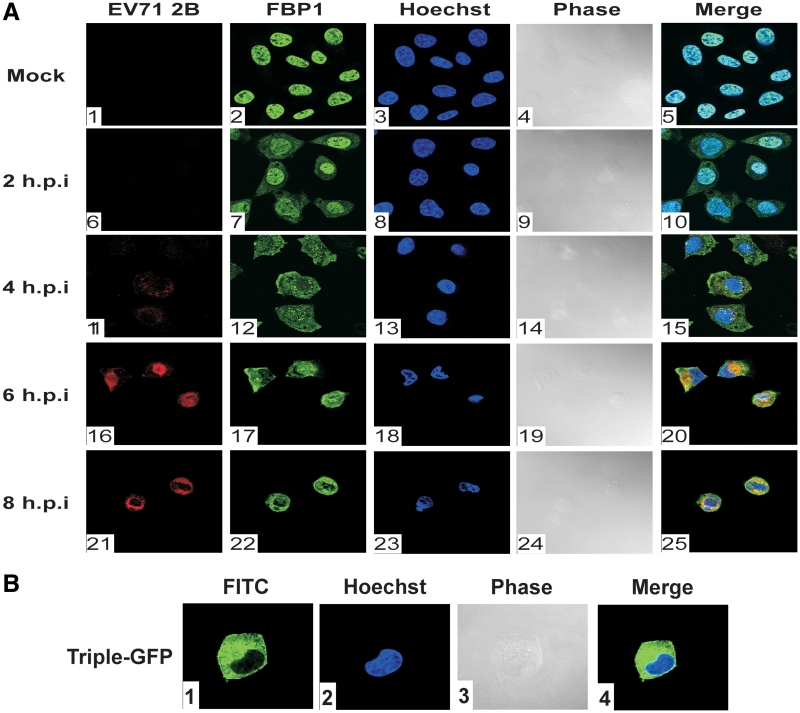
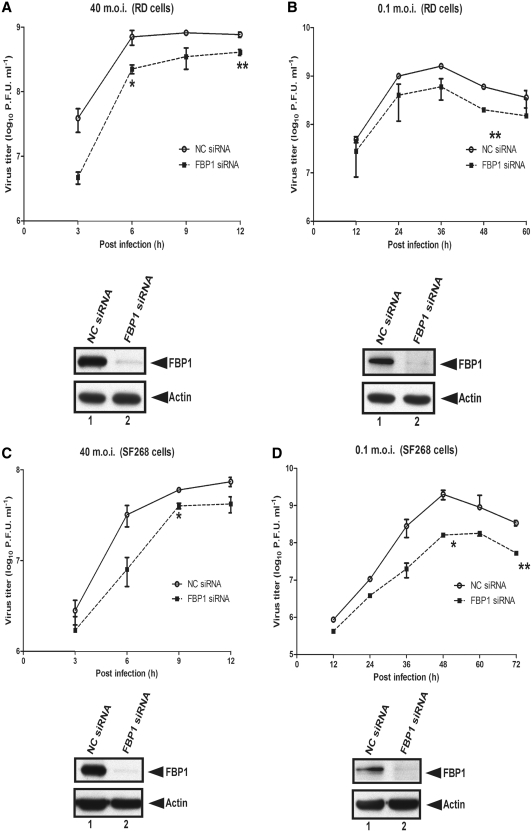
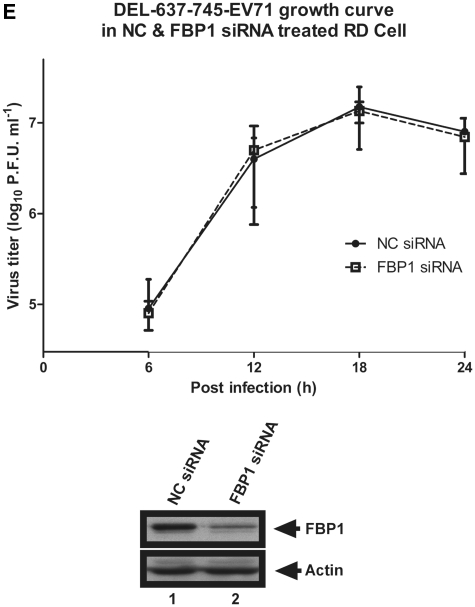
Enterovirus 71 (EV71) is associated with severe neurological disorders in children, and has been implicated as the infectious agent in several large-scale outbreaks with mortalities. Upon infection, the viral RNA is translated in a cap-independent manner to yield a large polyprotein precursor. This mechanism relies on the presence of an internal ribosome entry site (IRES) element within the 5'-untranslated region. Virus-host interactions in EV71-infected cells are crucial in assisting this process. We identified a novel positive IRES trans-acting factor, far upstream element binding protein 1 (FBP1). Using binding assays, we mapped the RNA determinants within the EV71 IRES responsible for FBP1 binding and mapped the protein domains involved in this interaction. We also demonstrated that during EV71 infection, the nuclear protein FBP1 is enriched in cytoplasm where viral replication occurs. Moreover, we showed that FBP1 acts as a positive regulator of EV71 replication by competing with negative ITAF for EV71 IRES binding. These new findings may provide a route to new anti-viral therapy.


Figures

Figure 1.
Figure 1.
FBP1 associates with EV71 5′-UTR. (A) FBP1 association with EV71 5′-UTR was confirmed by competition assay and western blot. The biotinylated RNA association proteins were loaded to SDS–PAGE (12%). FBP1 antibody was utilized in this western blot. Various amounts of unlabeled EV71 5′-UTR and yeast tRNA RNA probe were added to compete with the biotinylated EV71 5′-UTR probe interacting with FBP1 in RD cell lysate. Lanes 1 and 6 contained cell lysate (200 µg) only. An unlabeled EV71 5′-UTR RNA probe was used in the competition assay (lanes 3–5), and an unlableled yeast tRNA probe was utilized (lanes 8–10). (B) EV71 5′-UTR associates with cellular protein FBP1 in the various cell lines, SK-N-MC, SF268, RD and Vero cell. Cell lysates are shown in lanes 1, 6, 11 and 16. Various cell extracts were incubated in the absence of RNA (lanes 2, 7, 12 and 17) or in the presence of biotin-16-UTP only (lanes 3, 8, 13 and 18), non-biotinylated EV71 5′-UTR (lanes 4, 9, 14 and 19) or biotinylated EV71 5′-UTR (lanes 5, 10, 15 and 20). After the streptavidin beads were washed, the EV71 5′-UTR associated proteins were detected using SDS–PAGE (12%). FBP1 protein was analyzed by western blot with anti-FBP1 cellular protein antibody.
Figure 2.
Figure 2.
Identification of interaction regions in EV71 5′-UTR for FBP1. (A) M-FOLD software was applied to draw the EV71 5′-UTR RNA secondary structure. The numbers indicate the first and the last nucleotides in each stem-loop. The IRES element is from 1 to 636 nt, and the linker region is from 637 to 745 nt in EV71 5′-UTR. (B) Identification of FBP1 interaction region in EV71 5′-UTR. Various length, truncated forms of RNA probes, as indicated, were transcribed in vitro and biotinylated. RD cell lysates were incubated with these biotinylated RNA probes (lanes 2, 4, 6, 8, 10, 12, 14, 16, 18, 20, 22, 24 and 26). Non-biotinylated RNA probes were also applied in this assay as controls (lanes 1, 3, 5, 7, 9, 11, 13, 15, 17, 19, 21, 23 and 25). The RNA and protein complex associated beads were pulled down by streptavidin beads and resolved in the SDS–PAGE (12%). An anti-FBP1 antibody was applied to detect FBP1 in the pull-down complex. (C) Confirmation of FBP1 direct interaction in EV71 5′-UTR. The 50 fmol 32P-radiolabeled full-length EV71 5′-UTR 1–745 nt RNA (32P-EV71 1–745) (lanes 1–4) and 636–745 nt RNA (32P-EV71 636–745) (lanes 5–8) were utilized in electrophoretic mobility shift assays. Lanes 1 and 5 contained only 32P-radiolabeled RNA probe (lanes 1 and 5). The 2 pmol recombinant protein FBP1 was incubated with 32P-radiolabeled RNA probe and 10 pmol tRNA (lanes 2 and 6). The 2 pmol cold EV71 1–745 nt RNA probe (EV71 1–745), and cold EV71 636–745 RNA probe (EV71 636–745) (lanes 4 and 8) competed with 50 fmoles 32P-radiolabeled RNA probe in present recombinant FBP1. (D) EV71 5′-UTR RNA was pulled down with FBP1 from EV71-infected cell lysate. Anti-flag antibody was used in the immunoprecipitation assay. The RNA was extracted and subjected to the RT–PCR using EV71 5′-UTR-specific or RPS16-specific primers. Cell lysate without immunoprecipitation was used for RNA extraction (lanes 1 and 6) as an RT–PCR control. Anti-Flag antibody was incubated with 200 mg infected cell lysate and then underwent RNA extraction and RT-PCR analysis (lanes 2 and 7). The same reaction with anti-HA antibody, mouse IgG or without antibody was performed used as a negative control (lanes 3, 4, 5, 8, 9 and 10). H2O as a template was an RT–PCR negative control (lanes 6 and 12). FBP1 protein binds to the EV71 5′-UTR RNA but not to the control RNA (RPS16).
Figure 3.
Figure 3.
Identification of interaction domains in FBP1 for EV71 5′-UTR. (A) Schematic diagram of various truncated forms of FBP1. The black boxes indicate KH domains. The N-terminal domain and the C-terminal domain are as indicated. Fused flag tags at the N-terminals of various truncated forms of FBP1 were applied in a pull-down assay. The numbers of the truncated form FBP1 indicate first and last amino acids. (B) Map interaction regions in FBP1 for EV71 5′-UTR. Wild-type FBP1 (lane 1) or various truncated forms of FBP1 (lanes 4, 7, 10, 13, 16, 19, 22 and 25) expression plasmid were transfected into RD cells. Cell extracts from various transfected forms of FBP1 were collected and incubated with biotinylated EV71 5′-UTR RNA probe (lanes 3, 6, 9, 12, 15, 18, 21, 24 and 27) or non-biotinylated RNA probe (lanes 2, 5, 8, 11, 14, 17, 20, 23 and 26). Western blot using anti-Flag and anti-FBP1 antibodies was applied to examine protein expression. The RNA–protein complex with beads was resolved for SDS–PAGE (12%).
Figure 4.
Figure 4.
FBP1 localized to cytoplasm upon EV71 infection. (A) FBP1 localization in EV71-infected cells. Mock infected or infected with 40 m.o.i. EV71 after 2, 4, 6 and 8 h post-infection RD cells were fixed and stained with antibodies against FBP1 and EV71 viral protein 2B. Panels 1, 6, 11, 16 and 21 were used anti-2B antibody and were examined with a Rhodamin filter; panels 2, 7, 12, 17 and 22 were treated with anti-FBP1 antibody and examined with a FITC filter; panels 3, 8, 13, 18 and 23 present Hoechst 33258 examined with a 4′,6′-diamidino-2-phenylindole (DAPI) filter. Panels 4, 9, 14, 19 and 24 show mock-infected and EV71-infected RD cell morphology in phase, and panels 5, 10, 15, 20 and 20 show merged Rhodamin, FITC and Hoechst images. (B) Triple-GFP localization in mock-infected RD cells. A FITC signal was used to detect the triple-GFP location in cells (panel 1); Hoechst 33258 stained the nucleus of RD cell (panel 2). Triple-GFP transfected RD cells morphology shown in phase (panel 3), and the merged images shown as a control (panel 4). (C–E) Triple-GFP fused with FBP1 bipartite NLS, α4 NLS and YM NLS localize in RD cells upon EV71 infection. Triple-GFP fused various NLSs of FBP1 were transfected in RD cells and then challenged with EV71. Panels 1 and 6 were treated with anti-3A antibody and examined with a Rhodamin filter; panels 2 and 7 show cells examined with a FITC signal; panels 3 and 8 present Hoechst 33258 examined with a DAPI filter. Mock-infected and EV71-infected RD cell morphology are shown in phase (panels 4 and 9), and the merged images are shown as a control (panels 5 and 10).
Figure 4.
Figure 4.
FBP1 localized to cytoplasm upon EV71 infection. (A) FBP1 localization in EV71-infected cells. Mock infected or infected with 40 m.o.i. EV71 after 2, 4, 6 and 8 h post-infection RD cells were fixed and stained with antibodies against FBP1 and EV71 viral protein 2B. Panels 1, 6, 11, 16 and 21 were used anti-2B antibody and were examined with a Rhodamin filter; panels 2, 7, 12, 17 and 22 were treated with anti-FBP1 antibody and examined with a FITC filter; panels 3, 8, 13, 18 and 23 present Hoechst 33258 examined with a 4′,6′-diamidino-2-phenylindole (DAPI) filter. Panels 4, 9, 14, 19 and 24 show mock-infected and EV71-infected RD cell morphology in phase, and panels 5, 10, 15, 20 and 20 show merged Rhodamin, FITC and Hoechst images. (B) Triple-GFP localization in mock-infected RD cells. A FITC signal was used to detect the triple-GFP location in cells (panel 1); Hoechst 33258 stained the nucleus of RD cell (panel 2). Triple-GFP transfected RD cells morphology shown in phase (panel 3), and the merged images shown as a control (panel 4). (C–E) Triple-GFP fused with FBP1 bipartite NLS, α4 NLS and YM NLS localize in RD cells upon EV71 infection. Triple-GFP fused various NLSs of FBP1 were transfected in RD cells and then challenged with EV71. Panels 1 and 6 were treated with anti-3A antibody and examined with a Rhodamin filter; panels 2 and 7 show cells examined with a FITC signal; panels 3 and 8 present Hoechst 33258 examined with a DAPI filter. Mock-infected and EV71-infected RD cell morphology are shown in phase (panels 4 and 9), and the merged images are shown as a control (panels 5 and 10).
Figure 5.
Figure 5.
Viral IRES activity and viral protein synthesis were positively regulated by FBP1. (A) Schematic diagram of dicistronic reporter plasmids pRHF-EV71. Plasmid expresses dicistronic mRNA, consisting of cytomegalovirus (CMV) promoter, the first cistron RLuc gene, the EV71-5′-UTR and the second cistron FLuc. A hairpin (H) is inserted downstream of the first cistron to prevent ribosome read-through. RD cells were transfected siRNA against FBP1. After 3 days, dicistronic construct pRHF-EV71 and FBP1 siRNA were co-transfected into RD cells. After 2 days, the RLuc and FLuc activity in cell lysates were analyzed. The bars in the histogram represent FLuc/RLuc activity percentages. Experiments were performed in triplicate to obtain the bar graph. Western blotting was utilized analyze the expression levels of FBP1 and actin. (B) Schematic diagram of cap-dependent reporter pRH. RD cells were transfected FBP1 siRNA firstly. After 3 days, cap-dependent reporter construct pRH and FBP1 siRNA were co-transfected into RD cells. After 2 days, the RLuc activity in cell lysates were analyzed. Western blotting was utilized analyze the expression levels of FBP1 and actin. (C) Schematic diagram of monocistronic reporter EV71-5′-UTR-FLuc. Monocistronic mRNA containing EV71 IRES and FLuc was transfected to cells pre-treated with FBP1 siRNA or NC siRNA. At 6 h post-transfection, the RD cell lysate was assayed for FLuc activity. Cells were harvested, lysed and western blotted for FBP1 and actin. (D) In vitro IRES activity assay was performed contained monocistronic reporter RNA (EV71-5′-UTR-FLuc), different amounts recombinant FBP1 proteins or PTB, HeLa cells translation extracts and 20% RRL. The mixtures were incubated and measured FLuc activity. (E) Viral proteins synthesis in FBP1 knockdown cells. RD cells transfected with of NC siRNA or FBP1 siRNA were challenged with EV71 and subjected to a pulse-labeling assay. Protein synthesis in mock-infected (lanes 1 and 2), and EV71-infected cells were examined by 35S-methionine pulse-labeling at various times (lanes 3–6). Western blot analysis of FBP1 protein knockdown efficiency was performed (lower panels). (*P < 0.05, **P < 0.01 and ***P < 0.001, Student's two-tailed unpaired t-test).
Figure 5.
Figure 5.
Viral IRES activity and viral protein synthesis were positively regulated by FBP1. (A) Schematic diagram of dicistronic reporter plasmids pRHF-EV71. Plasmid expresses dicistronic mRNA, consisting of cytomegalovirus (CMV) promoter, the first cistron RLuc gene, the EV71-5′-UTR and the second cistron FLuc. A hairpin (H) is inserted downstream of the first cistron to prevent ribosome read-through. RD cells were transfected siRNA against FBP1. After 3 days, dicistronic construct pRHF-EV71 and FBP1 siRNA were co-transfected into RD cells. After 2 days, the RLuc and FLuc activity in cell lysates were analyzed. The bars in the histogram represent FLuc/RLuc activity percentages. Experiments were performed in triplicate to obtain the bar graph. Western blotting was utilized analyze the expression levels of FBP1 and actin. (B) Schematic diagram of cap-dependent reporter pRH. RD cells were transfected FBP1 siRNA firstly. After 3 days, cap-dependent reporter construct pRH and FBP1 siRNA were co-transfected into RD cells. After 2 days, the RLuc activity in cell lysates were analyzed. Western blotting was utilized analyze the expression levels of FBP1 and actin. (C) Schematic diagram of monocistronic reporter EV71-5′-UTR-FLuc. Monocistronic mRNA containing EV71 IRES and FLuc was transfected to cells pre-treated with FBP1 siRNA or NC siRNA. At 6 h post-transfection, the RD cell lysate was assayed for FLuc activity. Cells were harvested, lysed and western blotted for FBP1 and actin. (D) In vitro IRES activity assay was performed contained monocistronic reporter RNA (EV71-5′-UTR-FLuc), different amounts recombinant FBP1 proteins or PTB, HeLa cells translation extracts and 20% RRL. The mixtures were incubated and measured FLuc activity. (E) Viral proteins synthesis in FBP1 knockdown cells. RD cells transfected with of NC siRNA or FBP1 siRNA were challenged with EV71 and subjected to a pulse-labeling assay. Protein synthesis in mock-infected (lanes 1 and 2), and EV71-infected cells were examined by 35S-methionine pulse-labeling at various times (lanes 3–6). Western blot analysis of FBP1 protein knockdown efficiency was performed (lower panels). (*P < 0.05, **P < 0.01 and ***P < 0.001, Student's two-tailed unpaired t-test).
Figure 6.
Figure 6.
FBP1 outcompeted the binding of FBP2 to EV71 IRES. (A) The associated region in EV71 5′-UTR with FBP1 and FBP2. The linker region (636–745 nt) of the EV71 5′-UTR RNA probe was transcribed in vitro and biotinylated. RD cell lysates were incubated with a non-biotinylabeled RNA probe (lane 1) or a biotinylated RNA probe (lane 2). After being pulled down by Streptavidin beads, the protein complex was resolved in the SDS–PAGE (12%). Western blot was then performed to detect FBP1 and FBP2 in the pull-down complex. (B) The competition of FBP1 and FBP2 for IRES binding. The pull-down assay was performed here. The eluted proteins were subjected to SDS–PAGE (12%). Various amounts (µg) of FBP1 recombinant protein were added to compete with FBP2 of the cell lysate in interacting with the biotin-labeled EV71 5′-UTR RNA probe (EV71 1–745 nt) (lanes 2–6) and the linker region RNA probe (EV71 636–745 nt) (lanes 8–12). In the negative control, non-biotinylated RNA probes were applied the reaction (lanes 1 and 7). Antibodies against FBP1 and FBP2 were utilized in a western blot analysis.
Figure 7.
Figure 7.
EV71 exhibits a lower growth rate in FBP1 knockdown cells. (A and B) EV71 growth rate in FBP1 knockdown RD cells. RD cells were treated with NC siRNA or FBP1 siRNA for 48 h and then challenged with EV71 40 or 0.1 m.o.i. (C and D) EV71 growth rate in SF268 FBP1 siRNA-treated cells. SF268 cells were treated with NC siRNA or FBP1 siRNA for 48 h and then challenged with EV71 at m.o.i. of 40 or 0.1. A plaque assay was performed to measure the viral growth rate at various post-infection times. The lower panels demonstrate that FBP1 was knocked down following siRNA treatment. (E) Growth curves for truncated virus DEL-637-745-EV71 in NC and FBP1 siRNA-treated RD cells. RD cells were transfected NC and FBP1 siRNA and then infected with truncated virus DEL-637-745-EV71 at m.o.i. of 40. Viruses from the debris and the supernatant were collected together at 6, 12, 18 and 24 h post-infection. The virus titter was determined by plaque assay. The number shown in the vertical axis represents the virus titter as the log10 PFU per ml. The lower panels demonstrate that FBP1 was knocked down following siRNA treatment. (*P < 0.05, **P < 0.01, Student's two-tailed unpaired t-test).
Figure 7.
Figure 7.
EV71 exhibits a lower growth rate in FBP1 knockdown cells. (A and B) EV71 growth rate in FBP1 knockdown RD cells. RD cells were treated with NC siRNA or FBP1 siRNA for 48 h and then challenged with EV71 40 or 0.1 m.o.i. (C and D) EV71 growth rate in SF268 FBP1 siRNA-treated cells. SF268 cells were treated with NC siRNA or FBP1 siRNA for 48 h and then challenged with EV71 at m.o.i. of 40 or 0.1. A plaque assay was performed to measure the viral growth rate at various post-infection times. The lower panels demonstrate that FBP1 was knocked down following siRNA treatment. (E) Growth curves for truncated virus DEL-637-745-EV71 in NC and FBP1 siRNA-treated RD cells. RD cells were transfected NC and FBP1 siRNA and then infected with truncated virus DEL-637-745-EV71 at m.o.i. of 40. Viruses from the debris and the supernatant were collected together at 6, 12, 18 and 24 h post-infection. The virus titter was determined by plaque assay. The number shown in the vertical axis represents the virus titter as the log10 PFU per ml. The lower panels demonstrate that FBP1 was knocked down following siRNA treatment. (*P < 0.05, **P < 0.01, Student's two-tailed unpaired t-test).

Similar articles

Cited by

References

    1. McMinn PC. An overview of the evolution of enterovirus 71 and its clinical and public health significance. FEMS Microbiol. Rev. 2002;26:91–107. - PubMed
    1. Ho M, Chen ER, Hsu KH, Twu SJ, Chen KT, Tsai SF, Wang JR, Shih SR. An epidemic of enterovirus 71 infection in Taiwan. Taiwan Enterovirus Epidemic Working Group. N. Engl. J. Med. 1999;341:929–935. - PubMed
    1. Lin TY, Chang LY, Hsia SH, Huang YC, Chiu CH, Hsueh C, Shih SR, Liu CC, Wu MH. The 1998 enterovirus 71 outbreak in Taiwan: pathogenesis and management. Clin. Infect. Dis. 2002;34(Suppl. 2):S52–S57. - PubMed
    1. Gilbert GL, Dickson KE, Waters MJ, Kennett ML, Land SA, Sneddon M. Outbreak of enterovirus 71 infection in Victoria, Australia, with a high incidence of neurologic involvement. Pediatr. Infect. Dis. J. 1988;7:484–488. - PubMed
    1. Kehle J, Roth B, Metzger C, Pfitzner A, Enders G. Molecular characterization of an enterovirus 71 causing neurological disease in Germany. J. Neurovirol. 2003;9:126–128. - PubMed

Publication types

MeSH terms